
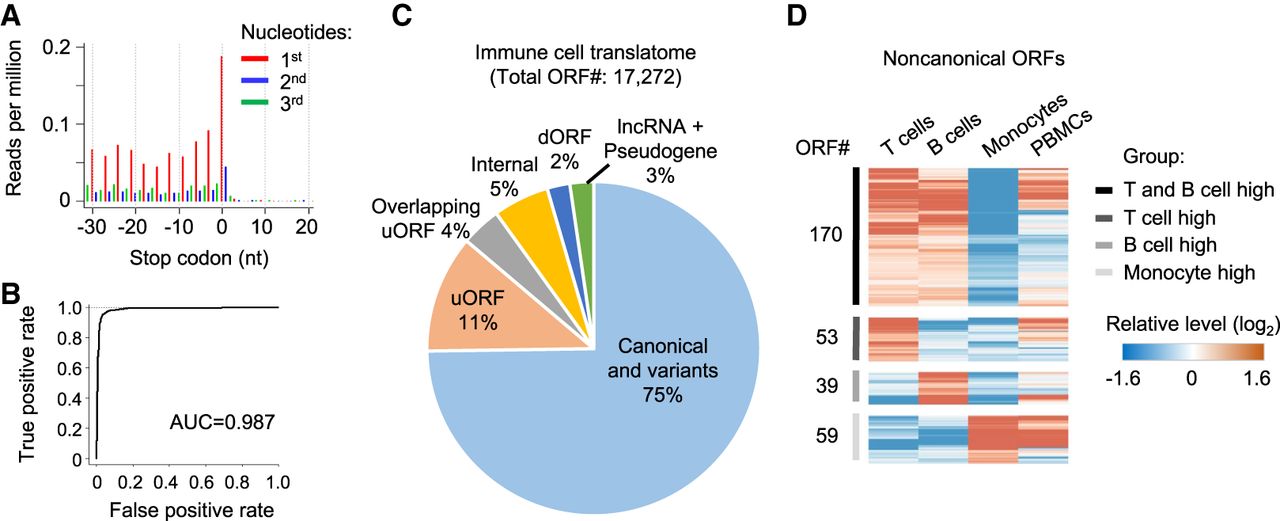
Regulation of noncanonical ORFs among primary immune cells. (A) Adjusted RNase footprinting read distribution around the stop codons of mRNAs. For footprints showing strong 3-nt periodicity, we adjusted their 5′-end genomic location to the ribosomal A-sites and plotted the RPM values (for details, see Methods). (B) The ROC curve measuring the RibORF performance in classifying in-frame-translated ORFs versus internal off-frame ORFs using RNase footprinting data in immune cells. The area under the ROC curve (AUC) value is shown. (C) The RibORF-identified genome-wide translated ORFs in immune cells, which were grouped based on their genomic locations. (uORF) ORF in 5′ UTR, (dORF) ORF in 3′ UTR, and (internal) ORF within canonical ORFs. (D) The heatmap showing lncRNA ORFs and uORFs with dynamic regulation of ribosome occupancy comparing T cells, B cells, and monocytes.


