
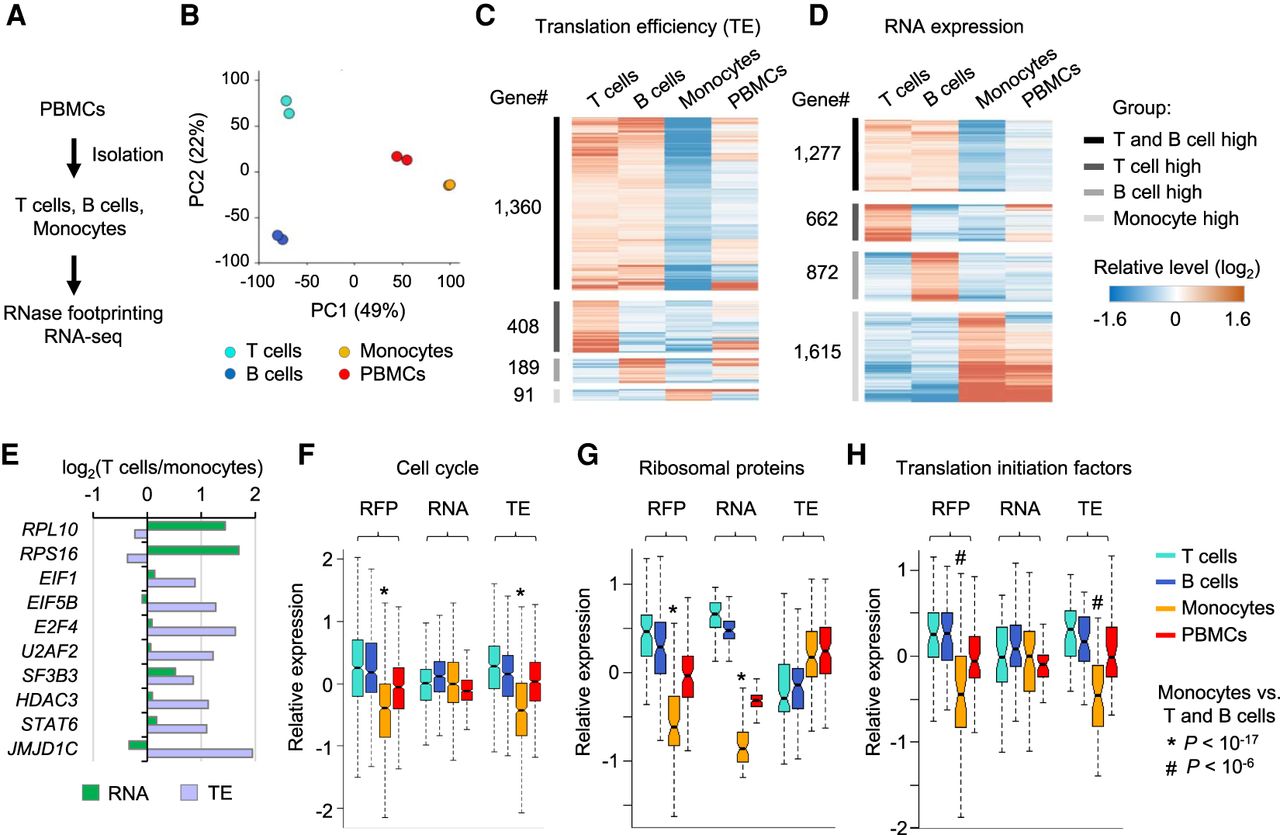
Regulation of RNA translation across human primary immune cell types. (A) Experimental steps to isolate T cells, B cells, and monocytes from PBMCs and then perform RNase footprinting and RNA-seq. (B) The principal component analysis (PCA) of ribosome occupancies of T cells, B cells, monocytes, and PBMCs. Genes showing more than twofold regulation across cells were used in the analyses. The percentages of variance explained by PC1 and PC2 are shown in parentheses. (C,D) The heatmap showing genes with regulation of translation efficiency (C) and RNA expression (D) comparing T cells, B cells, and monocytes. (E) Example genes showing differential RNA expression and translation efficiency, comparing T cells versus monocytes. (F–H) Boxplots showing the relative levels of ribosome occupancy (RFP), RNA expression, and translation efficiency (TE) for indicated genesets comparing T cells, B cells, monocytes, and PBMCs: “cell cycle” (F), “ribosomal proteins” (G), and “translation initiation factors” (H). The * or # label indicates the Wilcoxon rank-sum test P-value showing the geneset has significantly lower expression in monocytes, compared with both T cells and B cells.


