
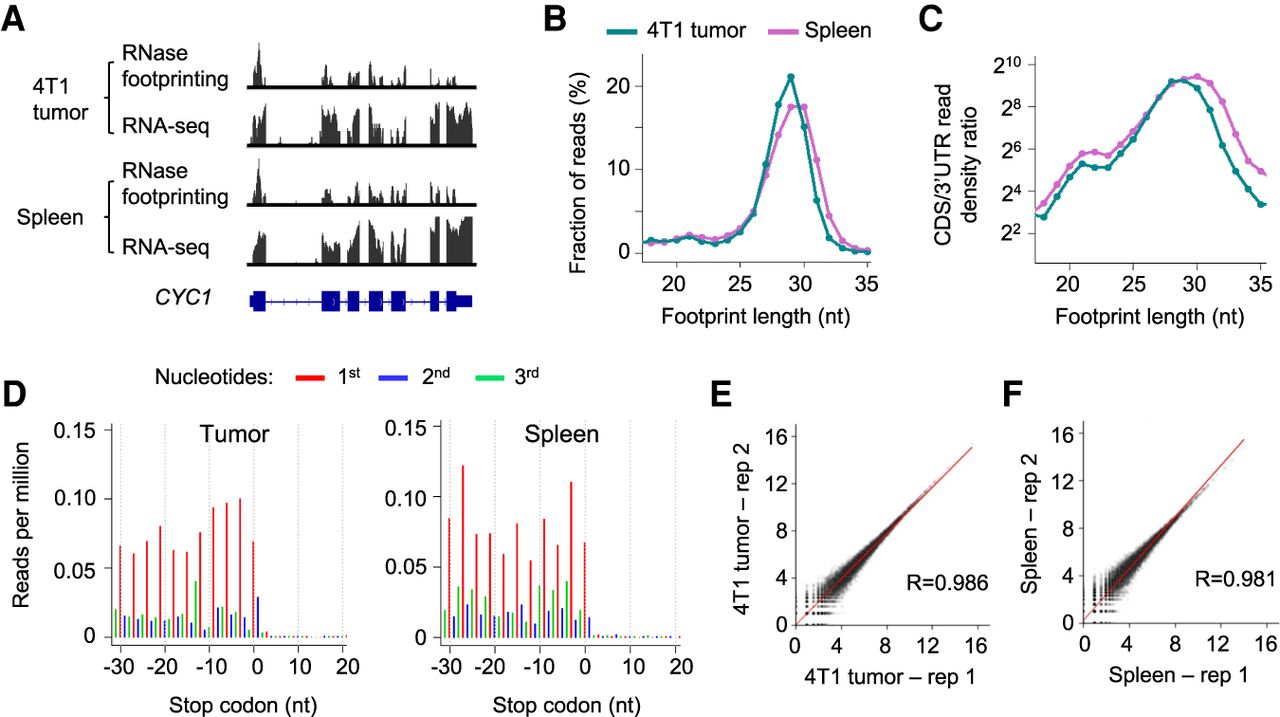
RNase footprinting maps RNA translation landscape using snap-frozen tumor and spleen tissues. (A) RNase footprinting and RNA-seq read distribution across the example gene CYC1. (B) The distribution of footprint lengths in coding regions of mRNAs. (C) The log2 ratio of read density in coding regions versus 3′ UTRs for each fragment size (18–35 nt). (D) Adjusted read distribution around the stop codons of mRNAs using RNase footprinting data of the 4T1 tumor and spleen tissues. We adjusted 5′-end genomic locations of the 29-nt footprints to the ribosomal A-sites. (E,F) Correlation of ribosome occupancy levels between two replicates of 4T1 tumor (E) and spleen tissues (F). The x-axis and y-axis represent log2(read count + 1) in coding regions.


