
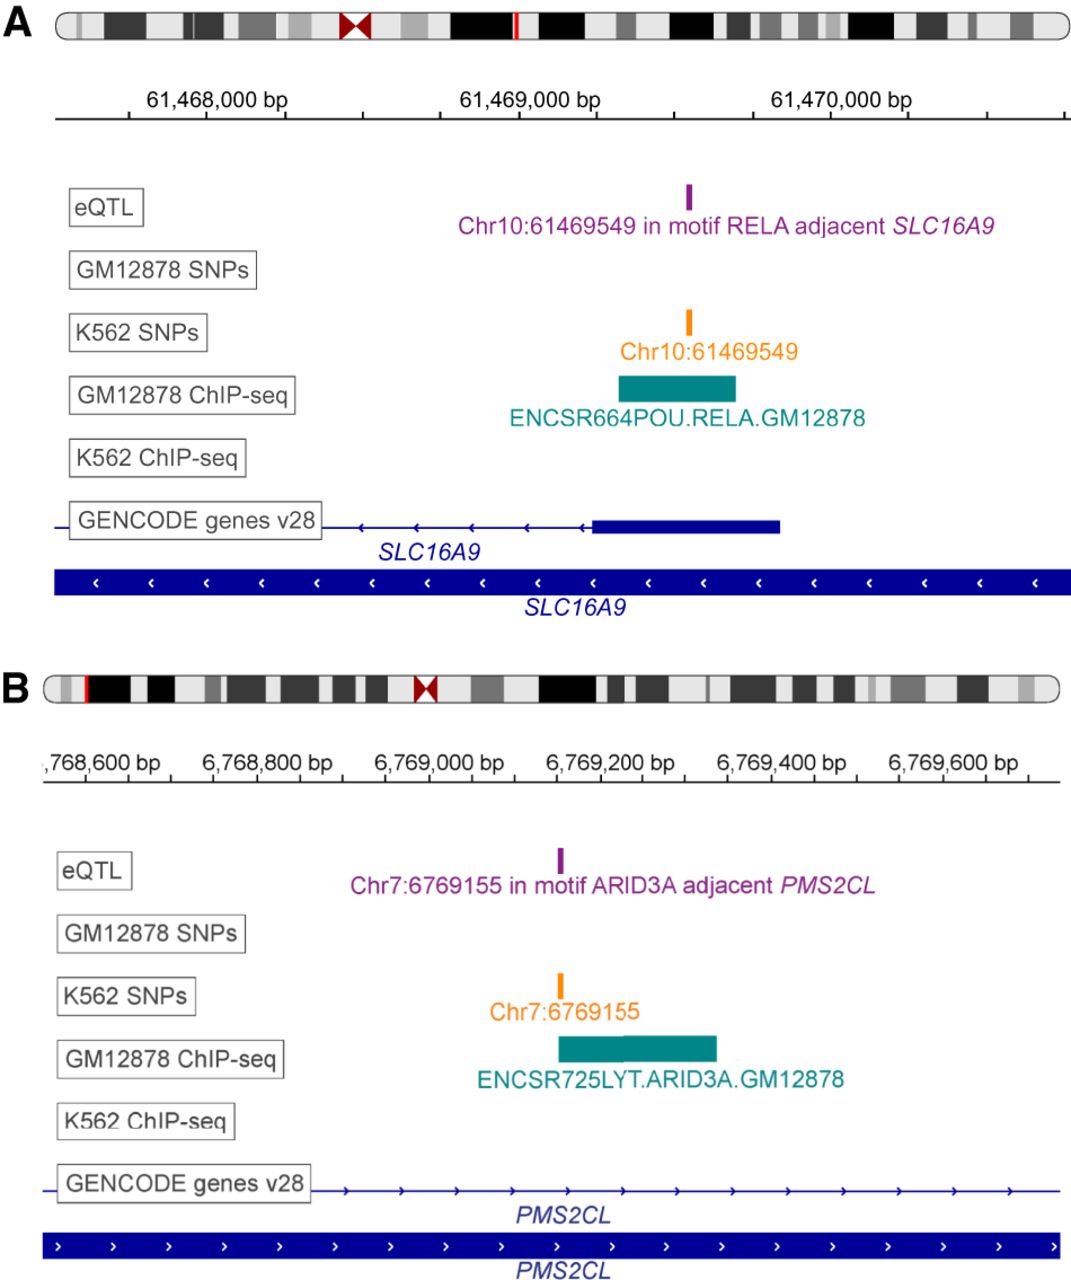
Figure 2.
EGRET identifies likely variant-impacted TF binding disruptions. (A) Example of RELA binding in K562 but not in GM12878. Positions of eQTLs (purple track), genetic variants (orange track), ChIP-seq binding regions from ReMap2 (teal track) (Chèneby et al. 2018), and genes (blue track) are shown in the region of SLC16A9. (B) Example of ARID3A binding in K562 but not in GM12878. Positions of eQTLs (purple track), genetic variants (orange track), ChIP-seq binding regions from ReMap2 (teal track) (Chèneby et al. 2018), and genes (blue track) are shown in the region of PMS2CL. The eQTL track is labeled according to the TF motif in which the eSNP resides as well as the adjacent eGene.


