
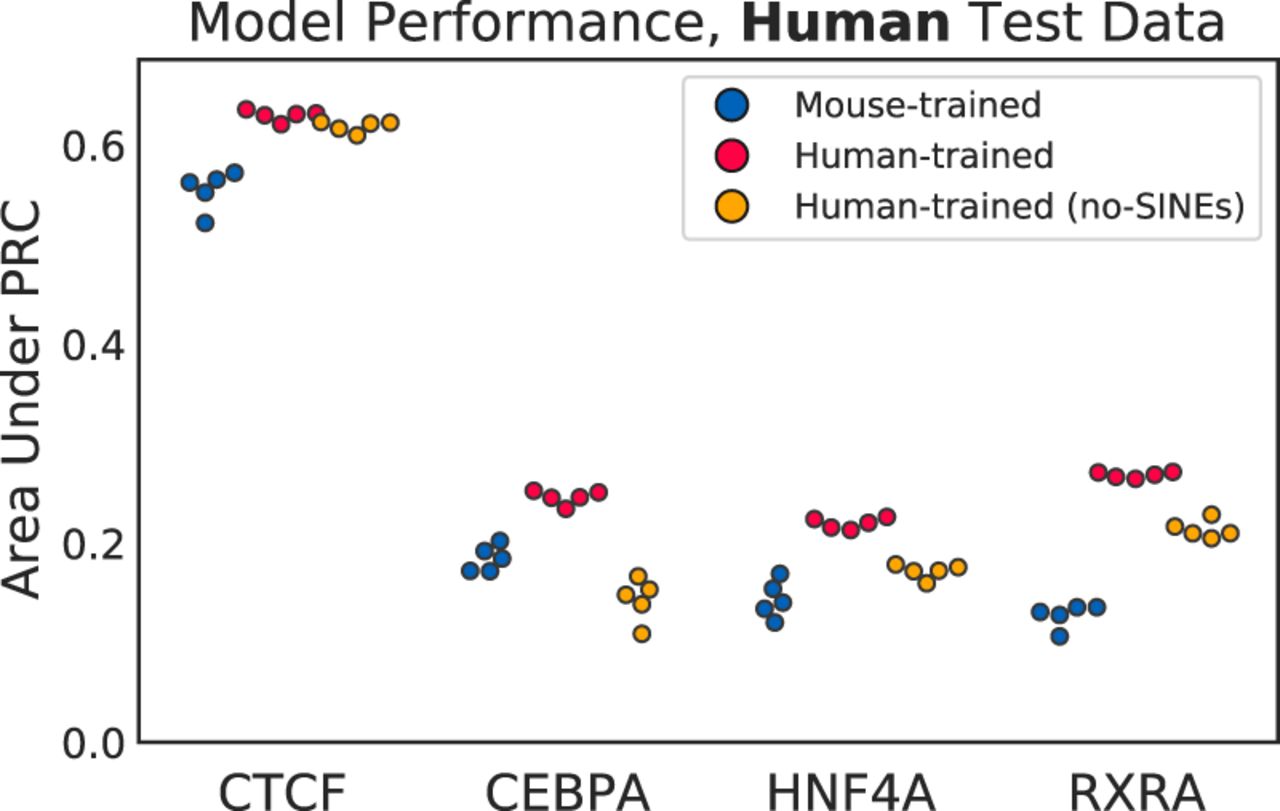
Figure 6.
Performance of models that are mouse-trained (blue), human-trained with SINE examples (red), and human-trained without SINE examples (yellow), evaluated on the held-out human Chromosome 2. Five models were independently trained for each TF and training species.


