
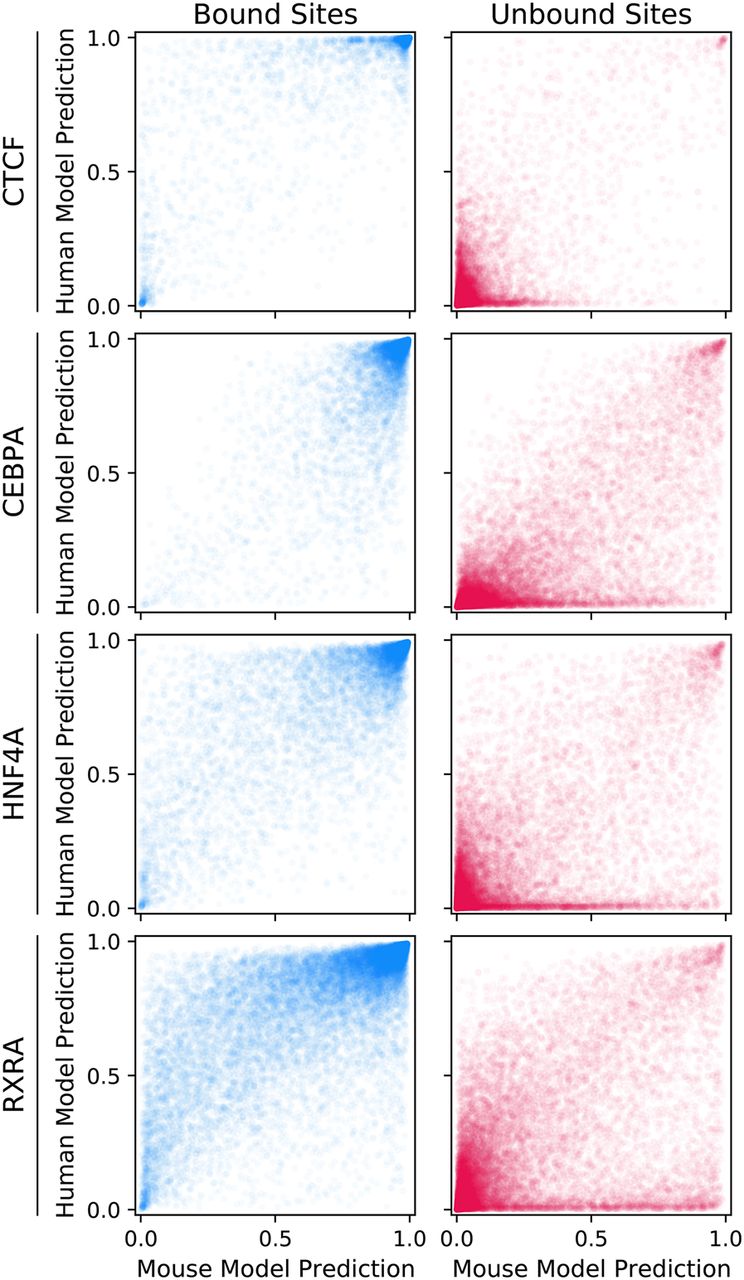
Figure 4.
Both bound and unbound sites from human Chromosome 2 show evidence of differential binding predictions by human-trained (y-axis) versus mouse-trained (x-axis) models. For visual clarity, only 25% of bound sites and 5% of unbound sites are shown (sampled systematically).


