
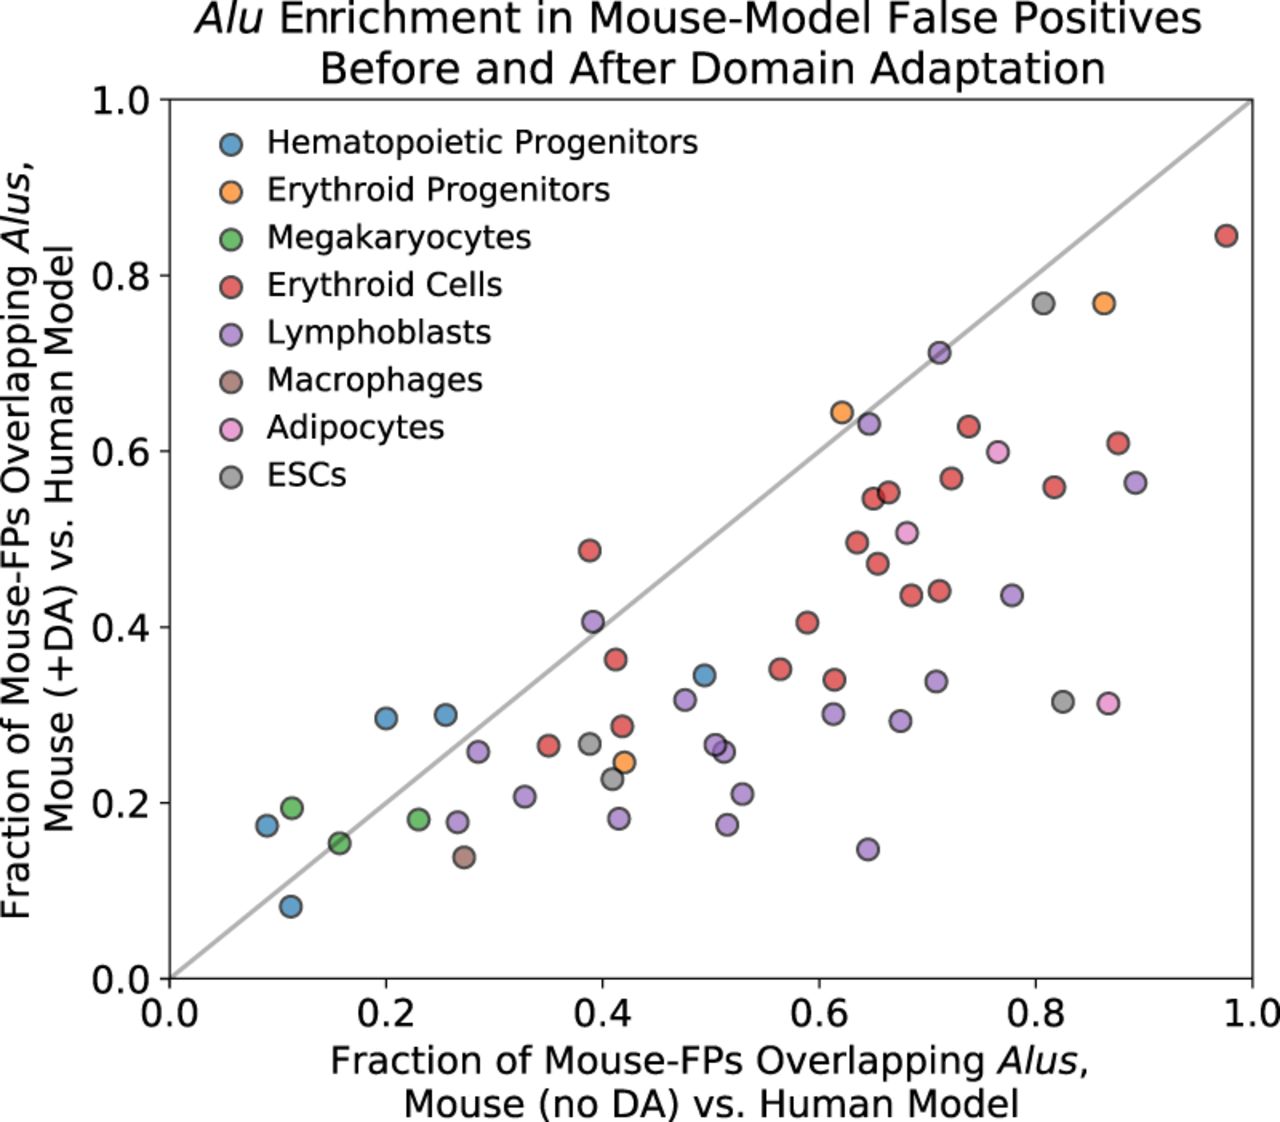
Figure 12.
The fraction of mouse-model-unique false positives that overlap Alus when either the basic mouse model (x-axis) or the domain-adaptive mouse model (y-axis) is compared against the human model, across our additional paired data sets. The gray diagonal line shows y = x; points below the line represent TFs where the fraction of Alus in mouse-model-unique false positives decreased with our domain adaptation strategy.


