
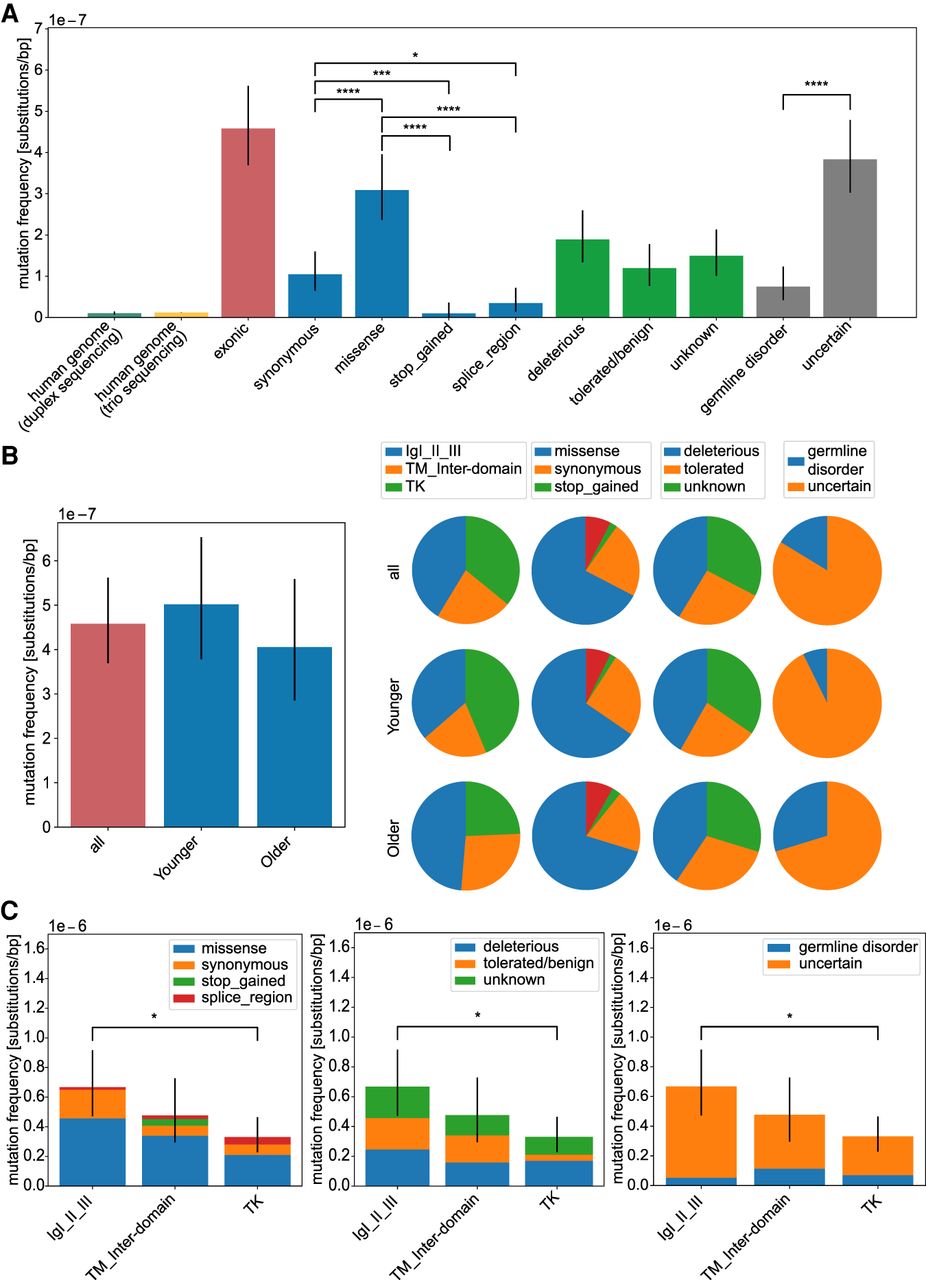
Analysis of mutation frequencies in FGFR3. Overall mutation frequencies estimated as number of variants (considered as DNM) divided by the number of sequenced nucleotides of the targeted regions. (A) Mutation frequencies (substitutions per base pair) measured in the human genome by duplex sequencing (Abascal et al. 2021) and trio sequencing (Kong et al. 2012) and compared with the exonic regions of FGFR3 (n = 92). We further subdivided the exonic mutations in the type of amino acid substitution (synonymous n = 21, missense n = 62, stop_gained n = 2, splice_region n = 7), in the effect on the protein based on the SIFT score (deleterious n = 38, tolerated/benign n = 24, unknown n = 30), or with a phenotype according to the HGMD database (germline disorder n = 15, uncertain n = 77) listed in detail in Supplemental Table S1. (B) Age dependency. Mutation frequencies compared between donor groups (all n = 92, younger n = 55, older n = 37). The pie charts are based on the mutation frequency for each group. (C) Domain analysis. Mutation frequencies compared among protein domains (IgI-III n = 38, TM_inter-domain n = 21, TK n = 33) categorized after substitution type, deleteriousness, and associated germline disorder. Error bars are confidence intervals of a Poisson distribution. For pairwise testing, the Chi-square test with Bonferroni–Holm correction was used, and only significant differences are shown in B and C. (*) P-value < 0.05; (****) P-value < 0.0001; (n.s.) P-value ≥ 0.05.


