
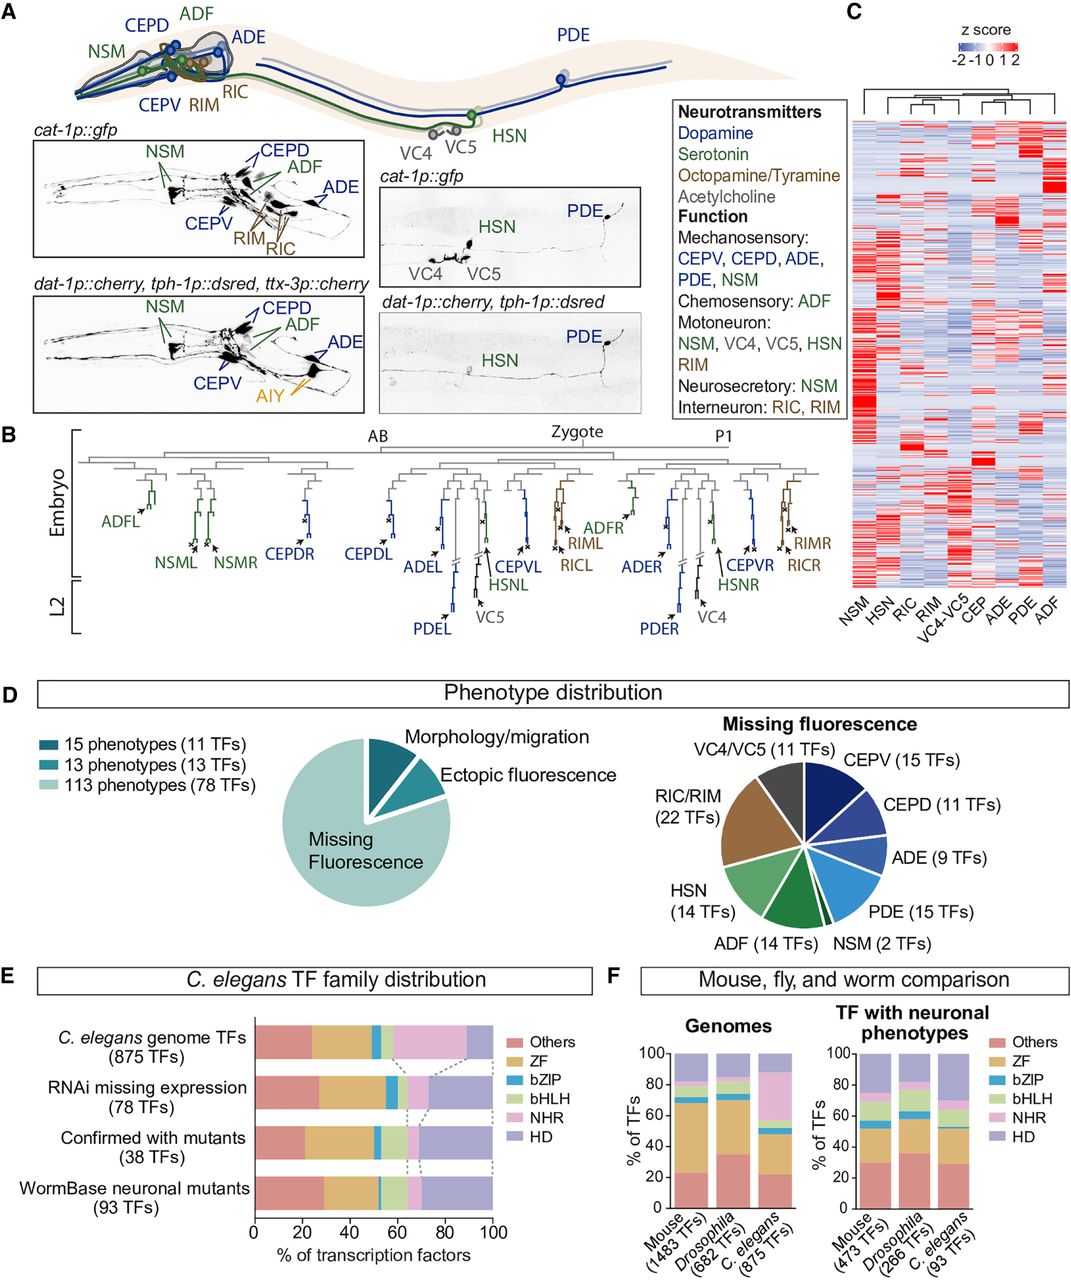
A genome-wide transcription factor RNAi screen reveals specific TF families are required for the specification of 11 neuron types. (A) otIs224(cat-1p::gfp) reporter strain labels nine classes of MA neurons (dopaminergic in blue, serotonergic in green and tyraminergic and octopaminergic in brown) and the VC4 and VC5 cholinergic motoneurons. AIM and RIH serotonergic neurons are not labeled by this reporter. HSN is both serotonergic and cholinergic. For the RNAi screen the dopaminergic otIs181(dat-1p::mcherry) and serotonergic vsIs97(tph-1p::dsred) reporters were also scored together with otIs224. ttx-3p:mcherry reporter, labeling AIY is cointegrated in otIs181 but was not scored. (B) Developmental C. elegans hermaphrodite lineage showing the diverse origins of neurons analyzed in this study. (C) Heatmap showing the disparate transcriptomes of the different MA neurons. Data obtained from larval L4 single-cell RNA-seq experiments (Taylor et al. 2021). (D) Phenotype distribution of TF RNAi screen results. Ninety-one TF RNAi clones produce 141 phenotypes because some TF RNAi clones are assigned to more than one cell type and/or phenotypic category. Most neuron types are affected by knockdown of at least nine different TFs. We could not differentiate between RIC and RIM owing to proximity and morphological similarity; thus, they were scored as a unique category. (E) TF family distribution of TFs in C. elegans genome, TFs retrieved in our RNAi screen, TFs confirmed by mutant analysis, and mutant alleles with any assigned neuronal phenotype in WormBase. Homeodomain TFs are overrepresented and NHR TFs decreased compared to the genome distribution. (F) Comparison of mouse, Drosophila, and C. elegans genomic TF family distribution and of TFs with assigned neuronal phenotypes. Distribution of mouse and Drosophila families with phenotypes is more similar to C. elegans than genomic distributions. Moreover, mouse HD prevalence in neuronal phenotypes is increased compared to genomic HD frequency, similar to C. elegans.


