
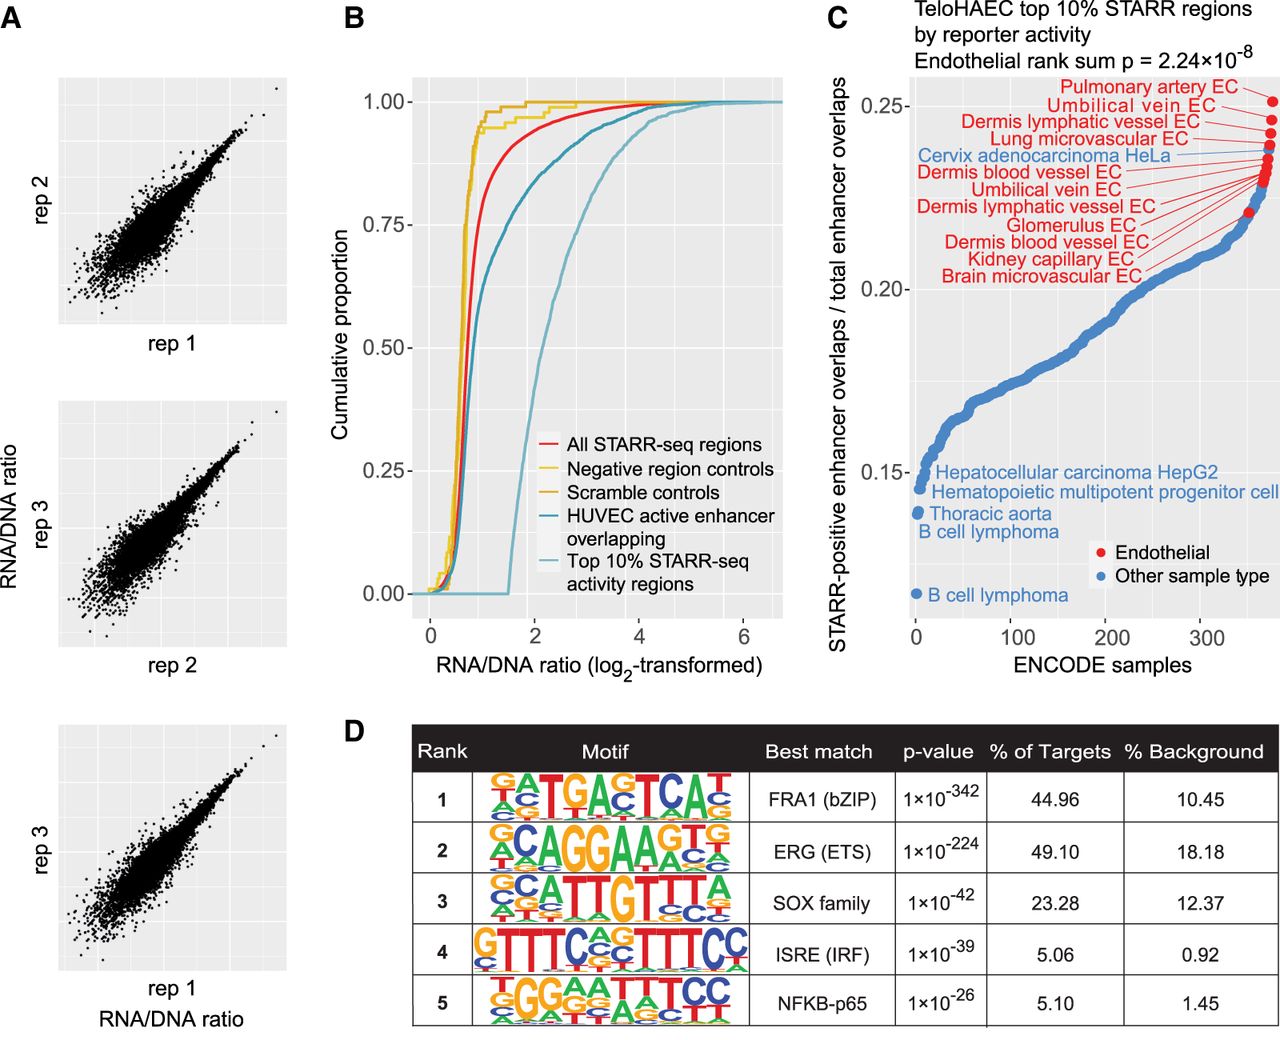
Enhancer activity profile of the STARR-seq reporter regions in teloHAEC cells. (A) STARR-seq replicate correlations for the measured reporter activity of library inserts normalized to DNA amounts in the input plasmid pool (the RNA/DNA ratio). (B) Cumulative distribution of enhancer activity (RNA/DNA ratio) for oligos overlapping active enhancers in HUVECs, compared to 100 scrambled regions,100 negative region oligos (that did not overlap any active chromatin marks in the ENCODE study). The activity distributions of the all STARR-seq regions and the top 10% most active regions are also shown. When selecting the top 10% most active STARR-seq regions, only the allele with the highest activity was considered for each region. (C) For different epigenomes, the fraction of enhancer-overlapping STARR-seq regions that are among the top 10% most active STARR-seq regions, as measured in teloHAECs. The active enhancers of each ENCODE sample were intersected with STARR-seq library regions to obtain the epigenome-specific set of enhancer overlapping oligos, which was then intersected with overall strongest reporter signals from teloHAEC STARR-seq. The top 10% regions were selected as in panel B. (D) De novo motif analysis of the STARR-seq regions showing enhancer activity within the upper 10th percentile in teloHAECs. The top 10% regions were selected as in panel B, and motif enrichment was calculated against all other regions in the library.


