
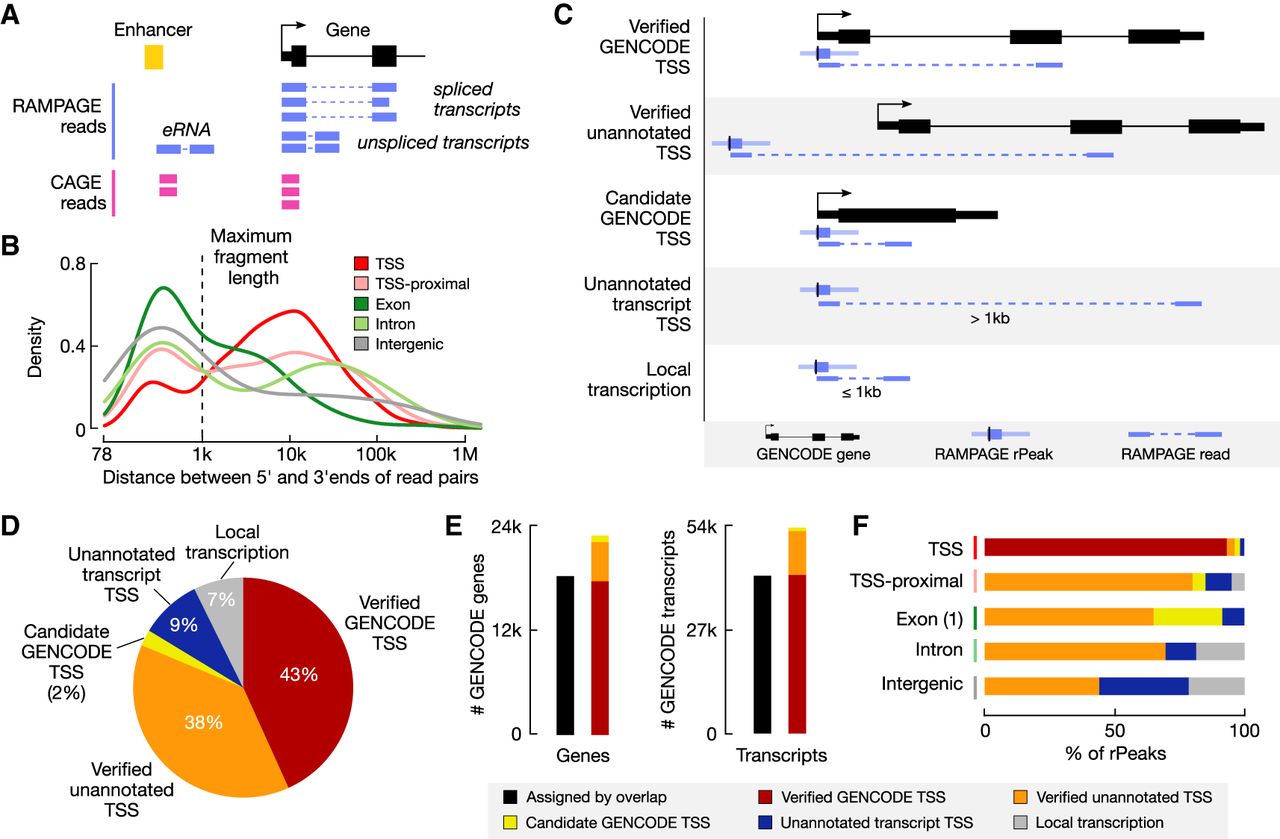
Assigning RAMPAGE rPeaks to genes using paired-end reads. (A) Schematic showing how paired-end RAMPAGE reads (purple) can distinguish between spliced and unspliced transcripts, unlike single-end CAGE reads (pink). (B) Density plot of the distances between the 5′ and 3′ ends of RAMPAGE read pairs, stratified by rPeak genomic context. The maximum fragment length (1 kb) is shown by the dashed line. (C) Schematic depicting the paired-end read method for linking RAMPAGE rPeaks with genes and the resulting five categories. (D) Pie chart displaying the percentage of RAMPAGE rPeaks classified as the five categories in C: verified GENCODE TSSs (red), verified unannotated TSSs (orange), candidate GENCODE TSSs (yellow), unannotated transcript TSSs (blue), or local transcription (gray). (E) Bar graphs showing the number of GENCODE genes (left) and transcripts (right) that are accounted for by overlapping RAMPAGE rPeaks (black) versus the paired-end read method illustrated in A and C (colors). Bars for the paired-end method are stratified by TSS class (as defined in C,D). Genes with multiple TSSs were counted only once with the following priority: verified GENCODE TSSs, verified unannotated TSSs, and then candidate GENCODE TSSs. (F) Bar graphs showing the percentage of rPeaks that are classified as verified GENCODE TSSs (red), verified unannotated TSSs (orange), candidate GENCODE TSSs (yellow), unannotated transcript TSSs (blue), or local transcription (gray), stratified by genomic context.


