
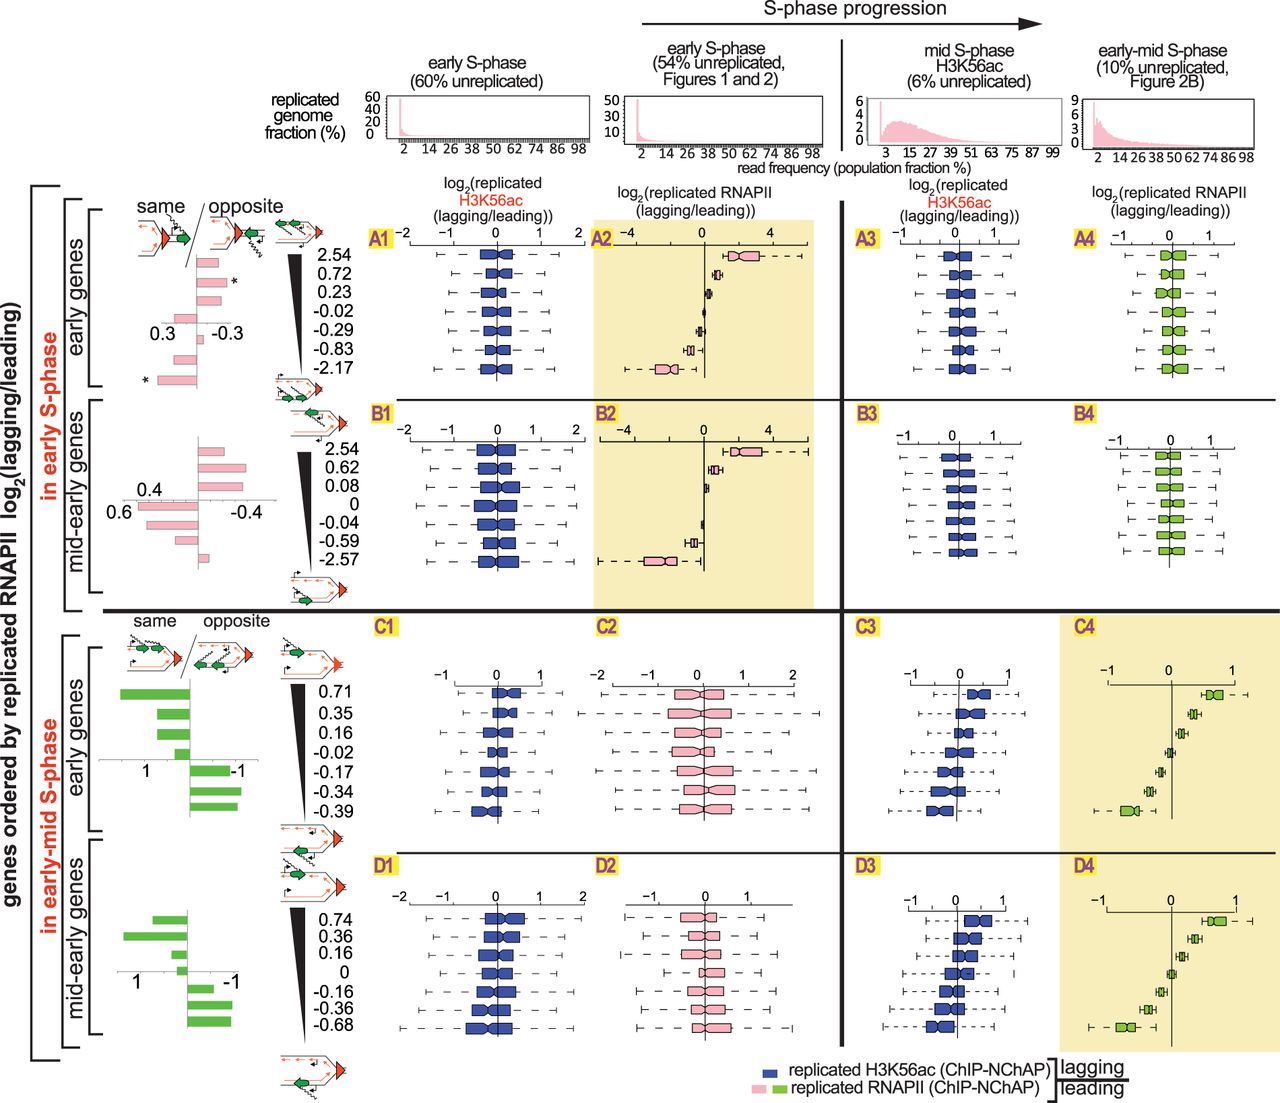
The asymmetric distribution of RNAPII on daughter chromatids is independent of the asymmetric distribution of new histones. Box plot distributions of lagging/leading ratios for replicated H3K56ac (dark blue) and replicated RNAPII (pink and green for early and early-mid S phase, respectively) in early (columns 1 and 2, respectively) and mid and early-mid (columns 3 and 4, respectively) S phase for early (rows A and C) and mid-early genes (rows B and D). (Header) Distribution of genome read densities, columns: (1) early S phase (MNase-NChAP, 60% unreplicated); (2) early S phase from Figure 2 (54% unreplicated); (3) bulk H3K56ac ChIP, mid S phase (6% unreplicated); (4) early-mid S phase (NChAP) from Figure 2B (10% unreplicated). (Rows A and B) Early and mid-early genes have been sorted by increasing lagging/leading RNAPII ratios from early S phase (Fig. 2B), respectively, and then divided into seven bins as in Figure 2B (y-axis), and box plot distributions of H3K56ac lagging/leading ratios (x-axis) from early (left) and mid (right) S phase have been determined (dark blue boxes) and compared with RNAPII lagging/leading ratios from early and early-mid S phase (pink and green boxes, respectively). The bar graphs on the left show the “same” gene enrichment calculated as in Figure 2B for gene bins indicated in the y-axis of each row on the right. (Rows C and D) As rows A and B but sorted by increasing lagging/leading RNAPII occupancy from early-mid S phase (Fig. 2B).


