
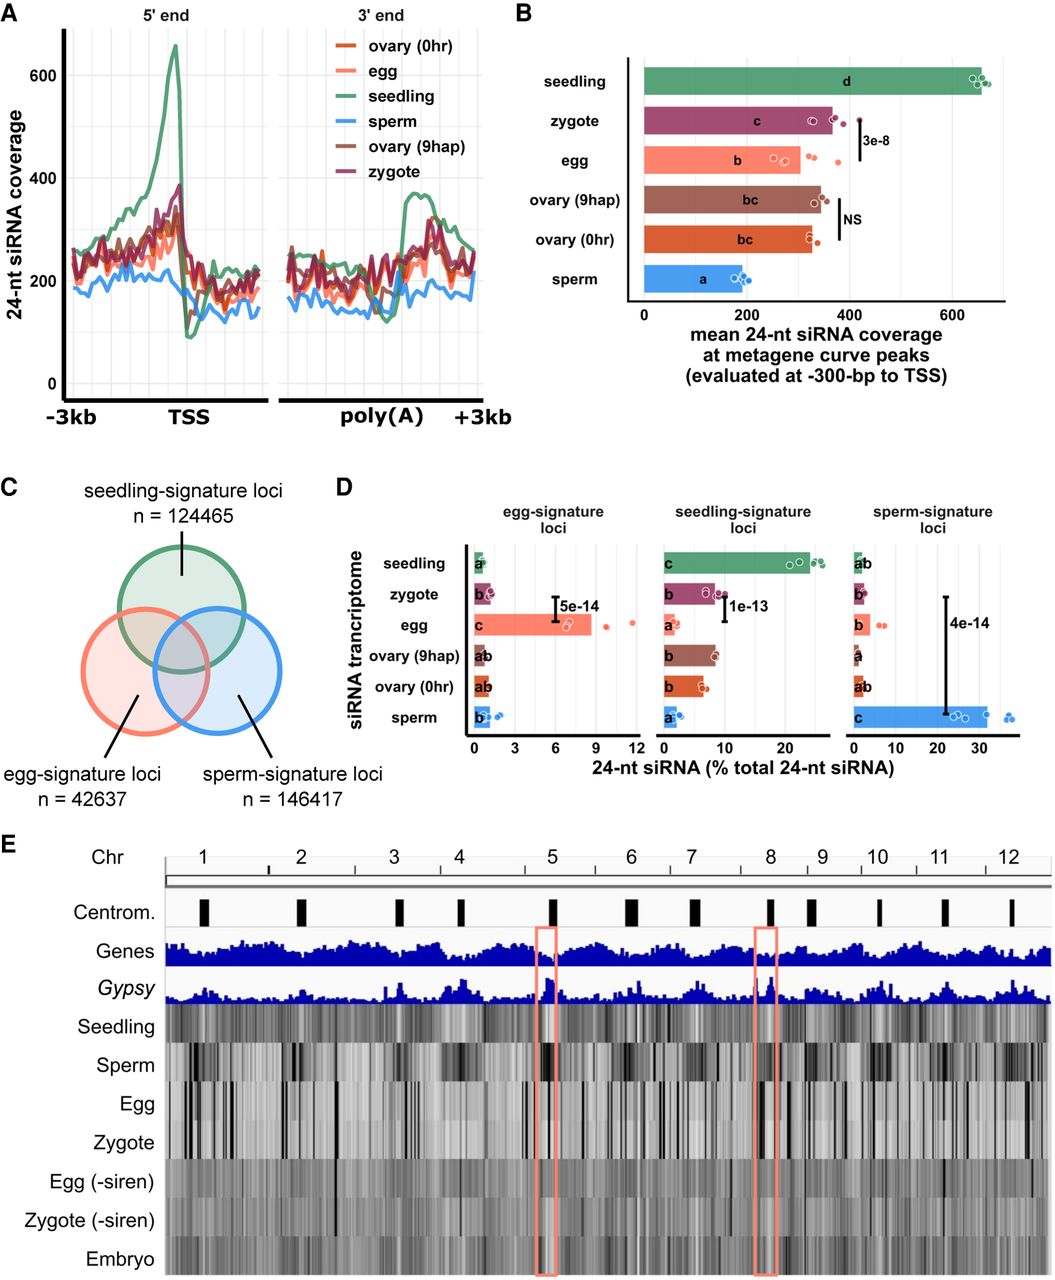
Changes in the zygote siRNA transcriptome after fertilization are independent from the ovary. (A) Metagene coverage plot for 24-nt siRNAs. Coverage is measured over 100-bp intervals and normalized per 1000 24-nt siRNAs. Vertical grid lines are 500-bp intervals. TSS transcription start site, poly(A) polyadenylation site. (B) Quantification of A at the interval from 300 to 200 bp upstream of TSS, corresponding to the peaks of metagene curves. Each data point is an siRNA transcriptome and bar heights are averages. x-axis values are normalized per 1000 24-nt siRNAs. (C) Venn diagram illustrating egg-signature loci (egg siRNA loci that do not overlap any seedling or sperm siRNA loci), seedling-signature loci (seedling siRNA loci that do not overlap any egg or sperm siRNA loci), and sperm-signature loci (sperm siRNA loci that do not overlap any egg or seedling siRNA loci). Sizes of overlap in Venn diagrams are not to scale. (D) Bar plot showing relative abundances of 24-nt siRNA across siRNA loci categories defined in C. The zygote siRNA transcriptome was not used to define these locus categories. Each data point is an siRNA transcriptome. Bar heights are averages. x-axis values are normalized to total 24-nt siRNAs. (E) Heat map showing abundance of 24-nt siRNA across the genome at 50-kb resolution. The first three tracks are centromeres (as defined by Mizuno et al. 2018), genes, and Gypsy retrotransposons. “−siren” refers to siren siRNAs removed. Pink boxes highlight examples of centromeric regions. Letter grouping (α = 0.05) and P-values are based on Tukey tests. Zygote and 9-hap ovary data are from this study; embryo (7–8 DAF) from Rodrigues et al. (2013); all other data from Li et al. (2020).


