
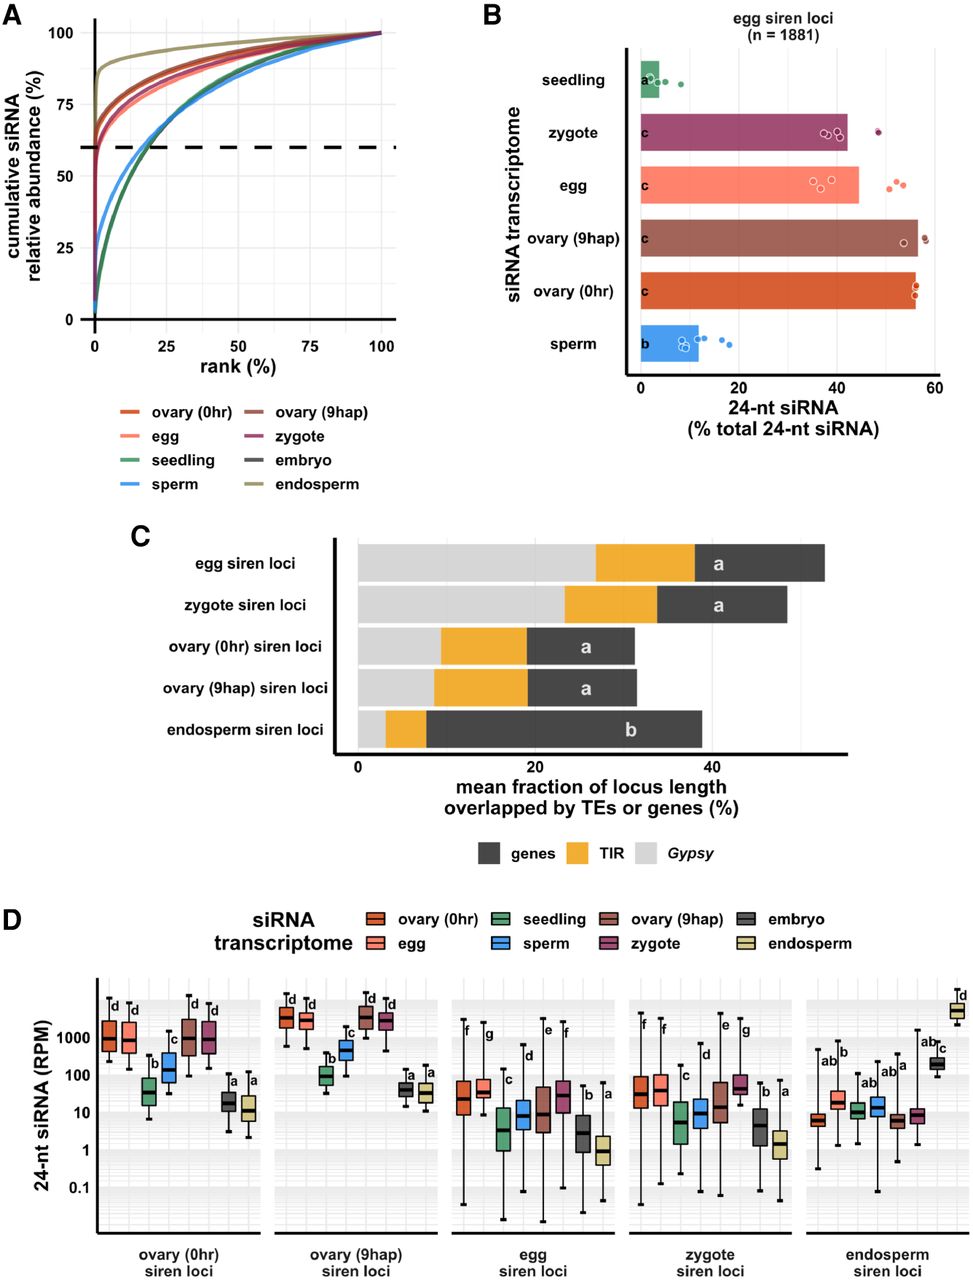
Zygote siren loci are similar to siren loci detected in ovary and egg cell, and stably expressed between egg and zygote, but dissimilar to siren loci detected in endosperm. (A) x-axis is the rank order of siRNA loci. siRNA loci with highest siRNA abundances are ranked first. y-axis is cumulative relative abundance of siRNA in all siRNA loci. Axis values are scaled between 0% and 100%. 0.1% of siRNA loci accounted for 60% of siRNA reads in all siRNA loci in endosperm and ovary; 1% of siRNA loci accounted for 60% of siRNA reads in all siRNA loci in egg and zygote. (B) Bar plot showing relative abundances of 24-nt siRNAs at egg siren loci. Each data point is an siRNA transcriptome. Bar heights are averages. x-axis values are relative to total 24-nt siRNAs. (C) Stacked bar plots showing mean fraction of locus length overlapped by TEs or genes. (TIR) Terminal inverted repeat transposons, CACTA superfamily excluded; (Gypsy) Gypsy retrotransposons. (D) Box plots showing 24-nt siRNA relative abundances across siren classes across cell types. Middle lines are medians. Whiskers span 2.5th and 97.5th percentiles. Boxes span interquartile range. y-axis values are relative to per million total 24-nt siRNAs in each siRNA transcriptome. Letter grouping (α = 0.05) and P-values are based on Tukey tests. Embryo and endosperm data from Rodrigues et al. (2013). Seedling, gametes, and pre-fertilization ovary data from Li et al. (2020).


