
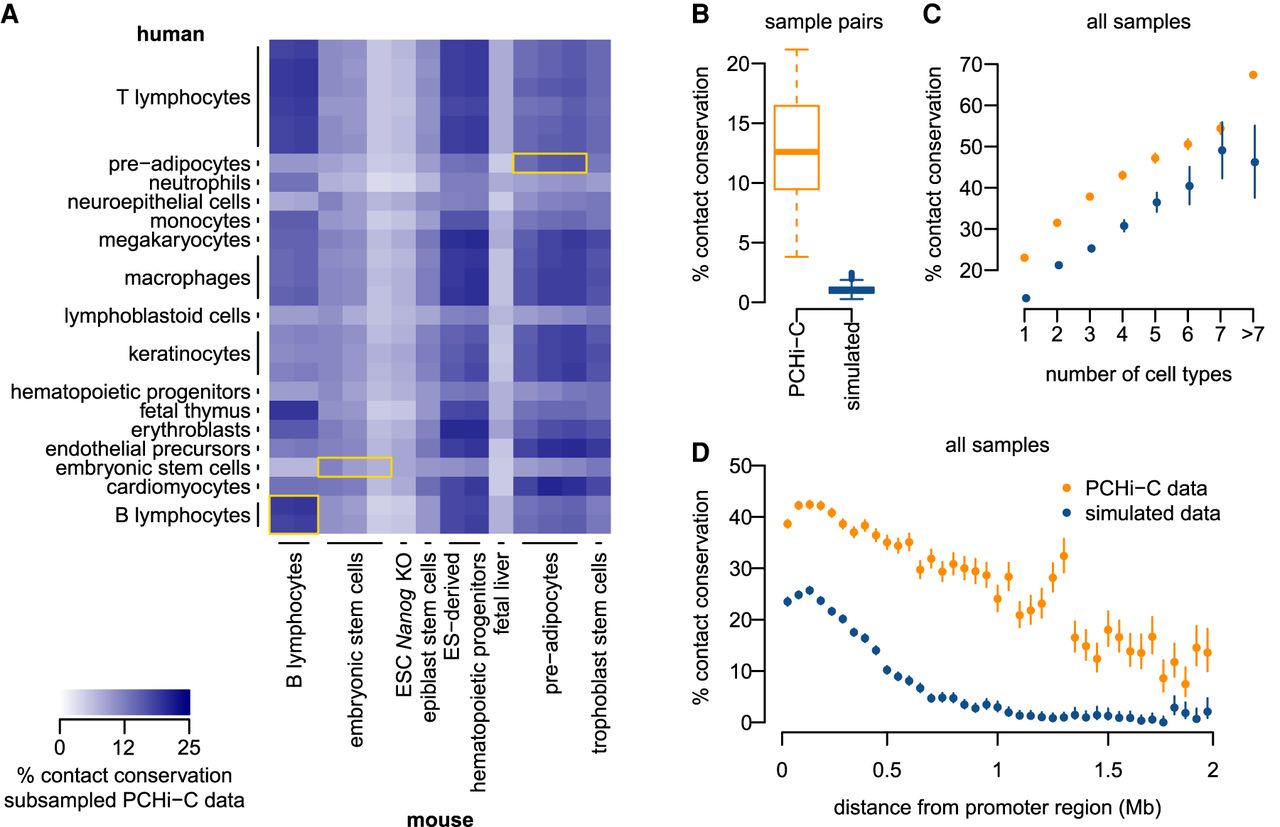
Chromatin contacts between promoters and enhancers are conserved. (A) Heatmap representing the frequency of contact conservation in comparisons between pairs of PCHi-C samples (one human sample and one mouse sample). We subsampled the PCHi-C data to obtain the same numbers of interactions for each sample (Methods). Yellow rectangles highlight comparable cell types. (B) Distribution of the frequency of contact conservation between all pairs of samples, for PCHi-C data (orange) and for simulated data (blue). (C) Proportion of human promoter–enhancer contacts conserved in mouse, as a function of the number of human cell types in which interactions are observed. (D) Proportion of human promoter–enhancer contacts conserved in mouse, as a function of the distance between the two elements in the human genome. (B,C) Bars represent 95% two-sided confidence intervals for the proportions (Methods).


