
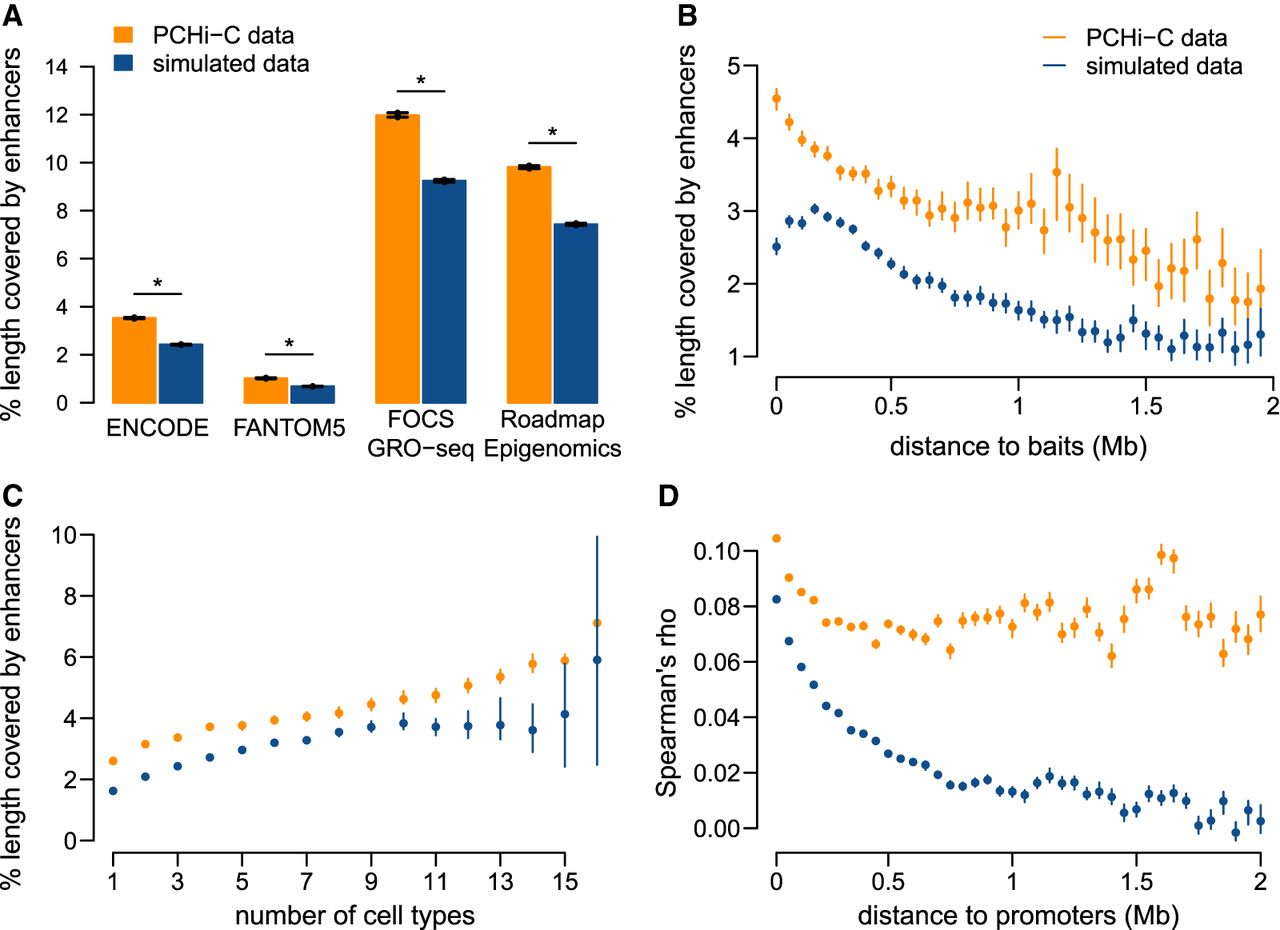
Gene–enhancer pairs connected by PCHi-C data are enriched in genuine regulatory interactions. (A) Average length fraction covered by predicted enhancers for restriction fragments contacted in human PCHi-C data (orange) and simulated data (blue). (B) Average length fraction covered by ENCODE enhancers, as a function of the distance between baits and contacted restriction fragments. (C) Average length fraction covered by ENCODE enhancers, as a function of the number of cell types in which interactions are observed, for human restriction fragments. (D) Distribution of Spearman's correlation coefficient between promoter and enhancer activity levels, for promoter–enhancer pairs in contact in PCHi-C data or in simulated data, according to the distance between them (Methods). (A–D) Bars and dots represent mean values; vertical segments represent 95% confidence intervals of the mean, obtained with a nonparametric bootstrap approach (Methods). (*) Significant difference between PCHi-C and simulated data (FDR < 10−10) based on a chi-squared test.


