
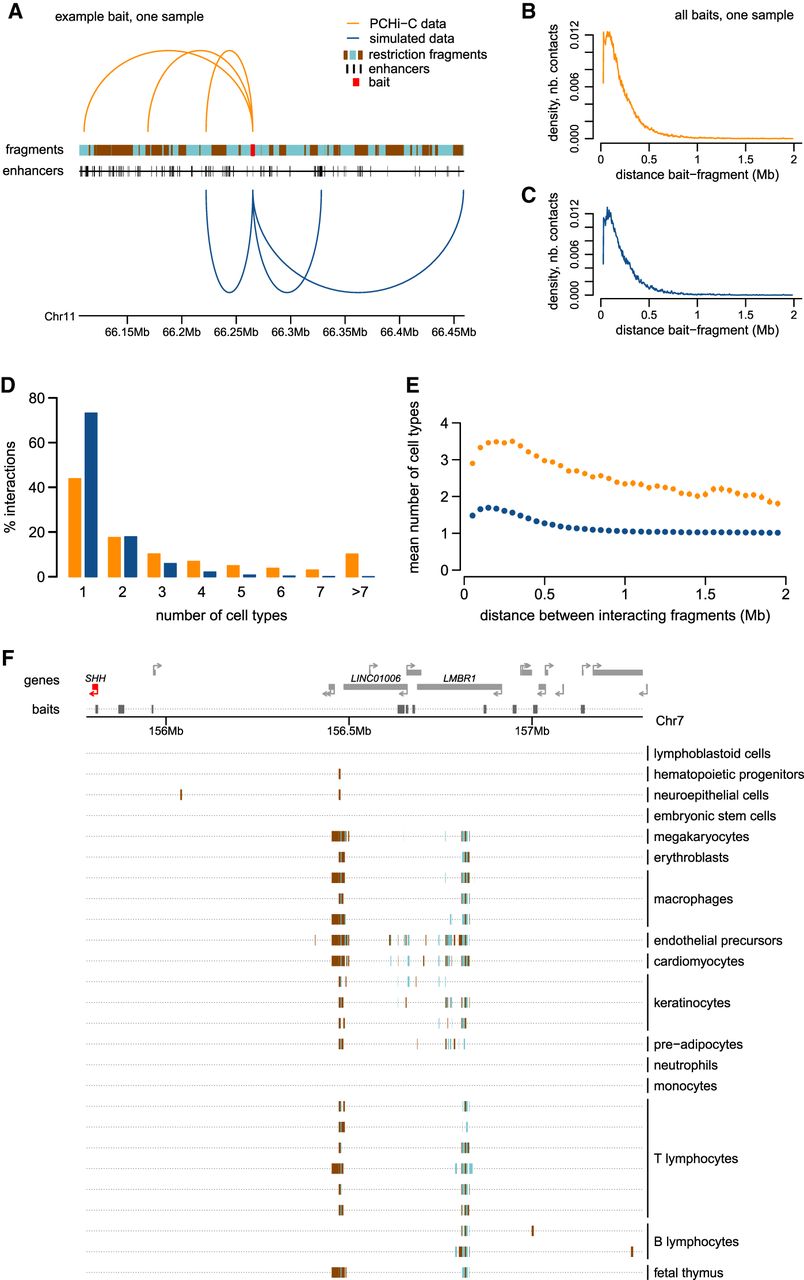
Chromatin interactions measured by PCHi-C data are shared among cell types. (A) Example of interactions between a baited restriction fragment (red) and other restriction fragments, for PCHi-C data (orange) and simulated data (blue). The positions of ENCODE enhancers are displayed below the restriction fragments track. (B) Distribution of genomic distances between baited fragments and contacted restriction fragments, in PCHi-C data (CD34 sample, human). (C) Same as B, for simulated data. (D) Histogram of the number of cell types in which interactions are observed, for human PCHi-C data and simulated data. (E) Average number of cell types in which interactions are observed, as a function of the distance between baits and contacted fragments. Dots represent mean values; vertical segments represent 95% confidence intervals of the mean obtained with a nonparametric bootstrap approach (Methods). (F) Chromatin contacts between the SHH gene promoter and other genomic regions. From top to bottom: gene coordinates; localization of PCHi-C baited fragments; and localization of restriction fragments contacted by the SHH bait in different samples. Rectangles with alternating colors indicate individual restriction fragments that are contacted by the SHH bait.


