
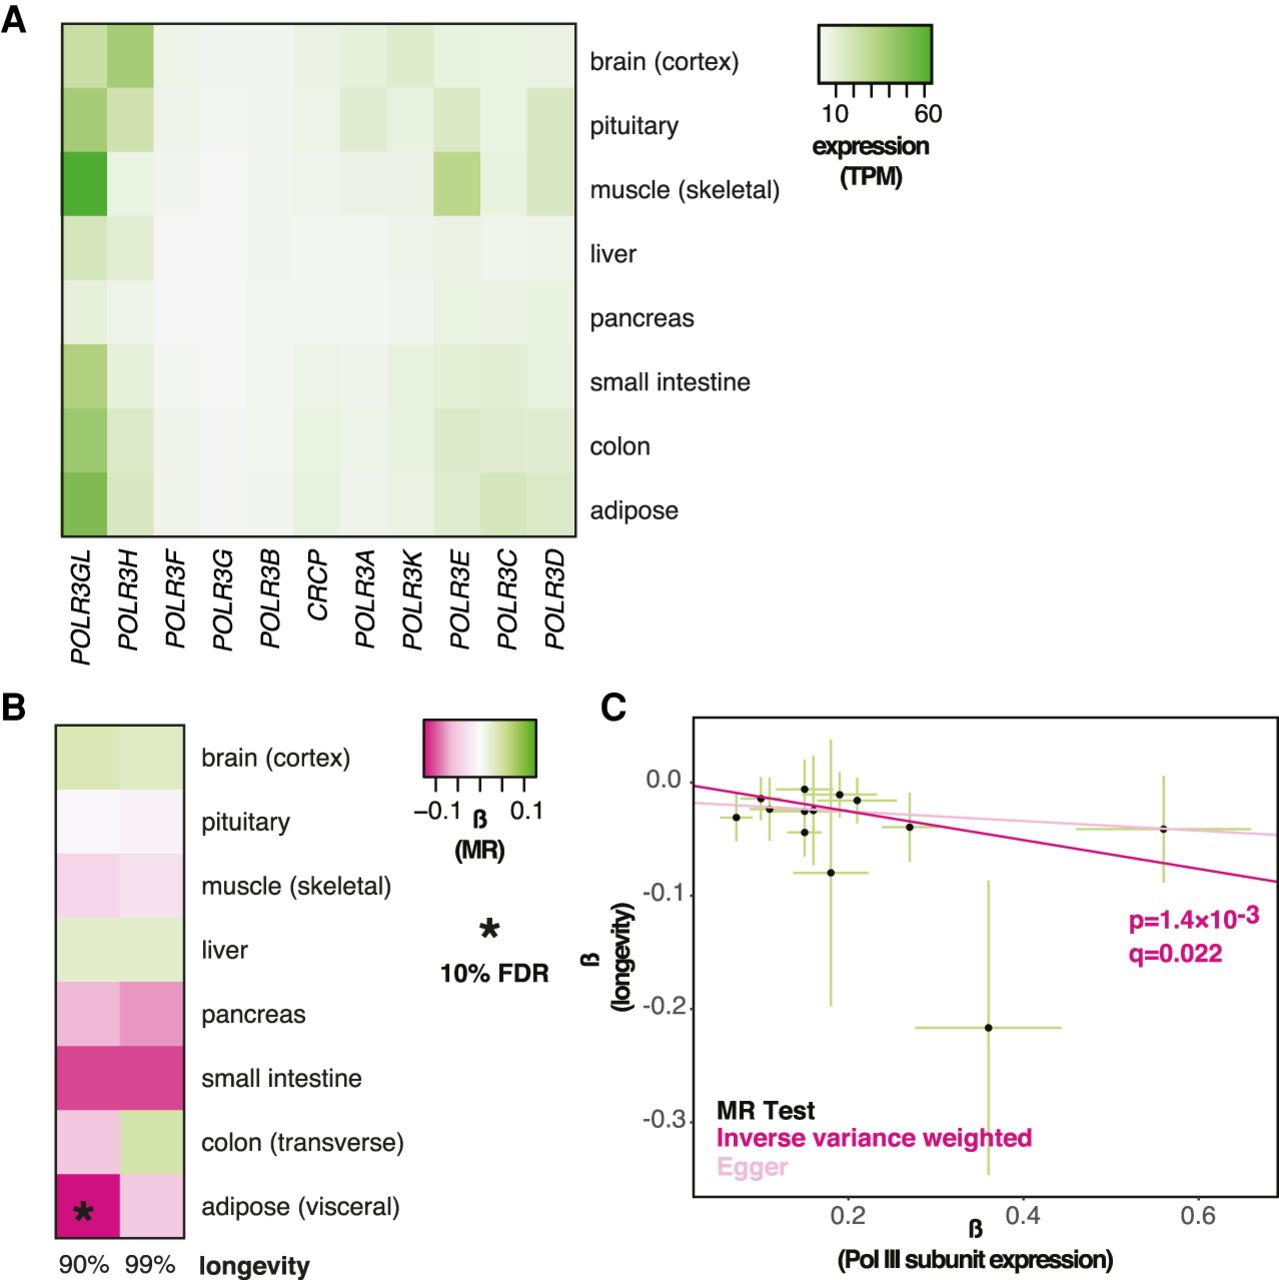
MR analysis of the association between the expression of Pol III–specific subunits and longevity. (A) Levels of mRNA coding for Pol III–specific subunits in the indicated tissues are shown. (TPM) Transcripts per million. (B) MR analysis was performed using Pol III–specific subunit expression in indicated tissues as exposures and longevity (survival beyond the 90th or 99th percentile) as outcomes. The values of β are given per tissue and the significant associations indicated as those that pass the 10% FDR threshold (accounting for eight tissues and two outcomes, i.e., 16 tests). (C) MR scatter plot of association between Pol III expression in visceral adipose and longevity (90th percentile), showing results of two MR methods. Each black point denotes a cis-eQTL; green bars show SEM. Longevity β is the natural log of the odds ratio, where lower values indicate a lower chance of surviving beyond the 90th percentile. Expression β is reported as normalized effect sizes (NESs), with larger values indicating higher expression, and refers to expression of multiple genes.


