
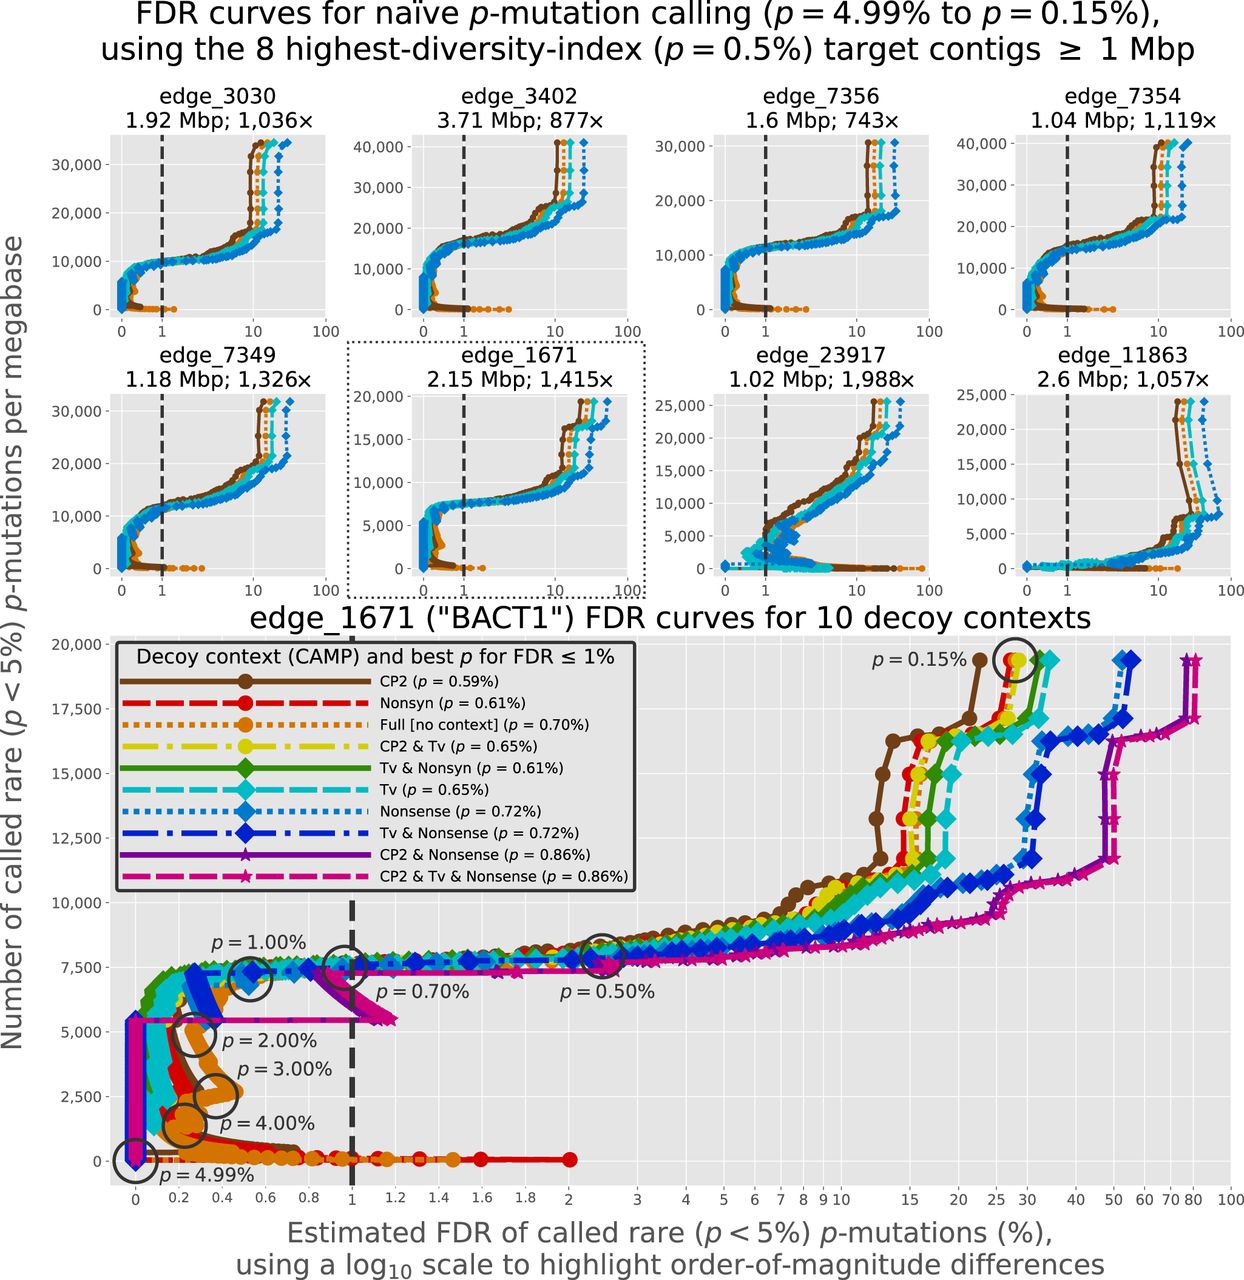
FDR curves for eight target contigs in SheepGut. We generate each FDR curve by using NaiveFreq to identify p-mutations in a selected decoy contig (CAMP) as well as the target contig, varying p from 4.99% to 0.15% in increments of 0.01%. (Top) Demonstration of four basic decoy contexts, resulting in four FDR curves per target contig. The “Full” context considers all mutations in all positions of the decoy contig; the “CP2” context considers all mutations in only positions located in the second codon position of a single predicted gene in the decoy contig; the “Tv” context only considers transversion mutations in all positions of the decoy contig; and the “Nonsense” context only considers single-nucleotide nonsense mutations in only positions located in a single predicted gene in the decoy contig. (Bottom) Demonstration of 10 decoy contexts, using BACT1 as the target contig. In addition to the four contexts shown in the above plots, this includes the “Nonsyn” context (corresponding to nonsynonymous mutations) as well as combinations of contexts (Supplemental Material, “Nonsynonymous, nonsense, and transversion decoy contexts”). Fixing the estimated FDR to 1% (indicated by the vertical dashed line shown in all plots) implies a “best” (smallest) value of p for a target contig that allows calling the rarest p-mutations while keeping the estimated FDR ≤ 1%: For BACT1, these values are listed in the legend for each decoy context. For clarity, we circle and label certain values of p on the “Full” curve.


