
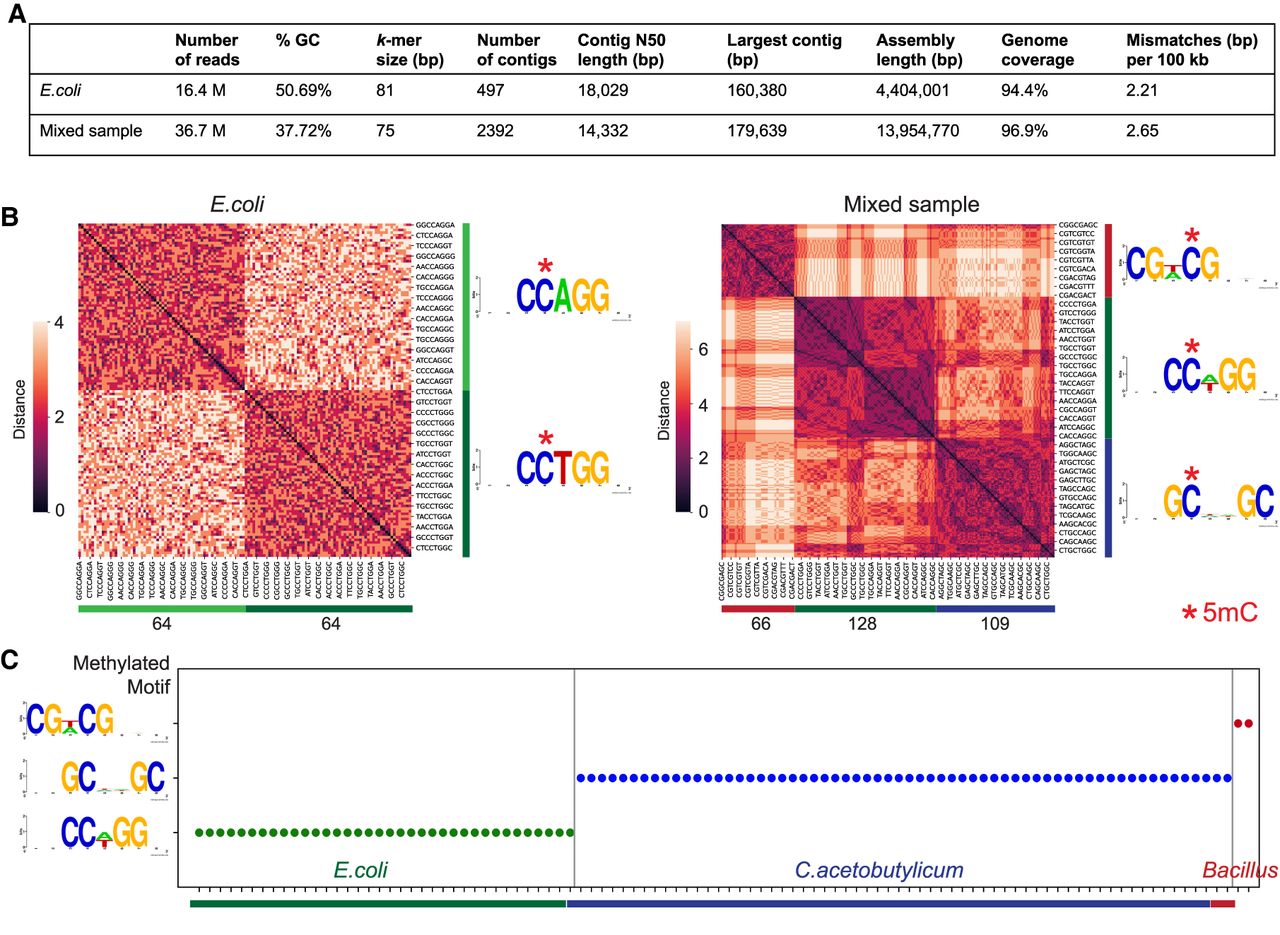
Figure 6.
Methyl-SNP-seq applied to bacteria. (A) Summary of genome assembly using deconvoluted reads. Genome coverage was measured against E. coli or E. coli + C. acetobutylicum reference genome using QUAST. (B) Hierarchy clustering of significantly enriched 8-mers and the corresponding motif logo (generated by WebLogo [Crooks et al. 2004]) for E. coli and mixed sample (E. coli + C. acetobutylicum). The number at the bottom represents the number of enriched k-mers in each cluster. (C) Identified methyltransferase motif for the top 100 largest assembled contigs. Each dot represents a contig.


