
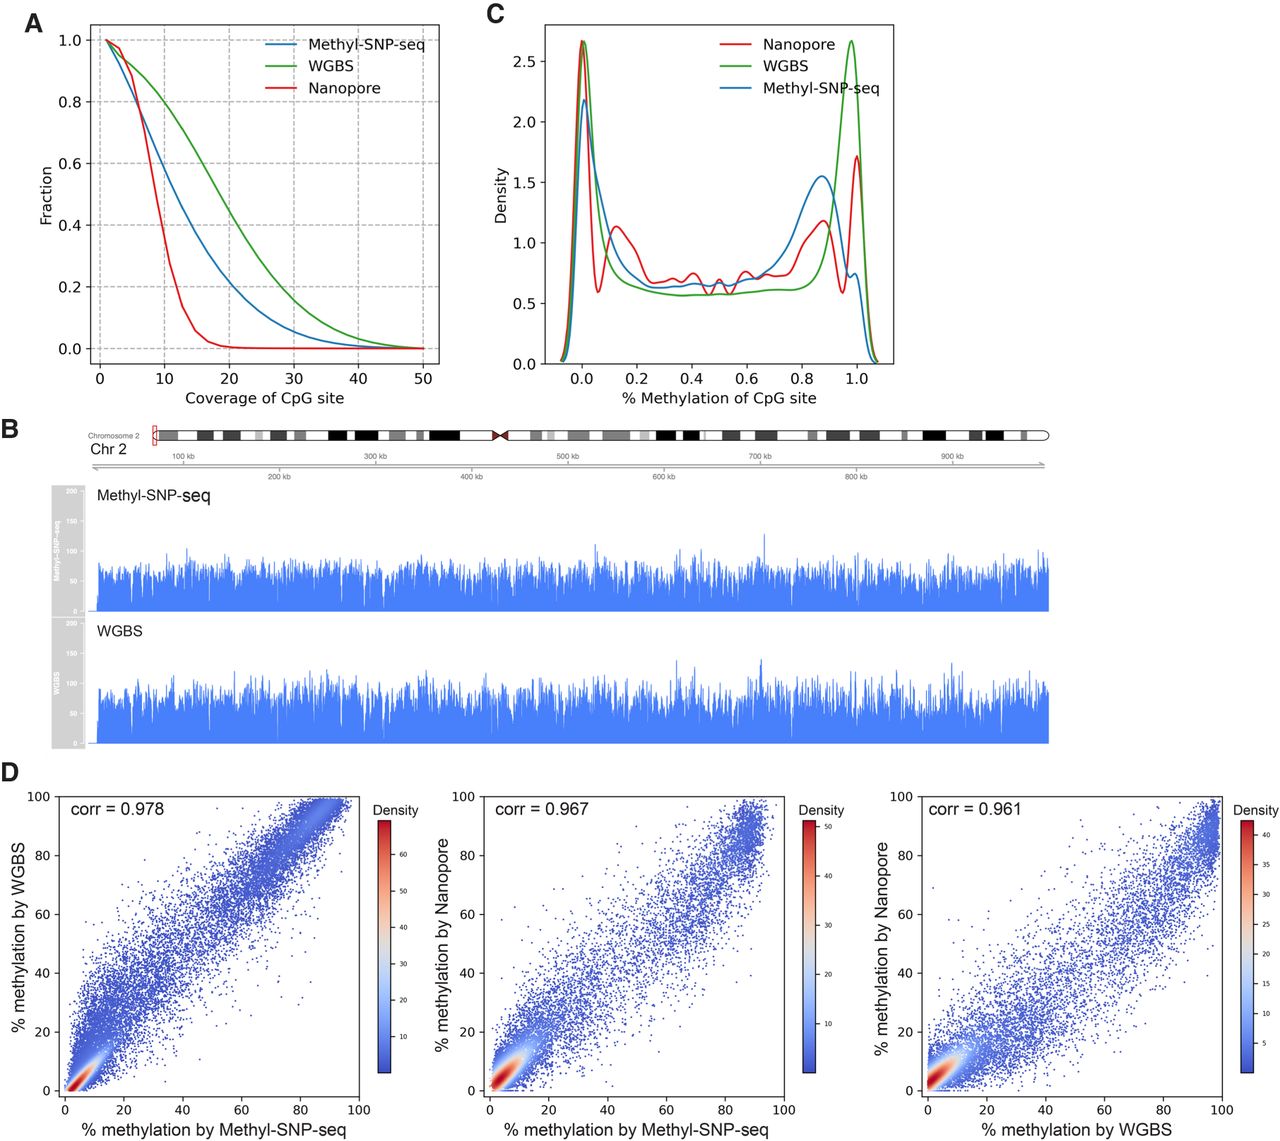
Methylome. (A) Distribution of coverage on CpG sites for Methyl-SNP-seq (blue), whole-genome bisulfite sequencing (WGBS) (green), and Nanopore (red). (B) Read coverage on part of the human Chr 2 for Methyl-SNP-seq (top) and WGBS (bottom). (C) Distribution (kde plot) of % methylation on CpG sites having coverage ≥ 5. (D) Pairwise comparison of the methylation level of CpG islands measured by Methyl-SNP-seq, whole-genome bisulfite sequencing from ENCODE (WGBS), and Nanopore sequencing. Each dot represents the percentage methylation at CpG island. Only CpG islands having coverage ≥ 50 were used for correlation calculation. A total of 27,050; 27,313; and 16,071 CpG islands were detected by Methyl-SNP-seq, WGBS, and Nanopore sequencing, respectively.


