
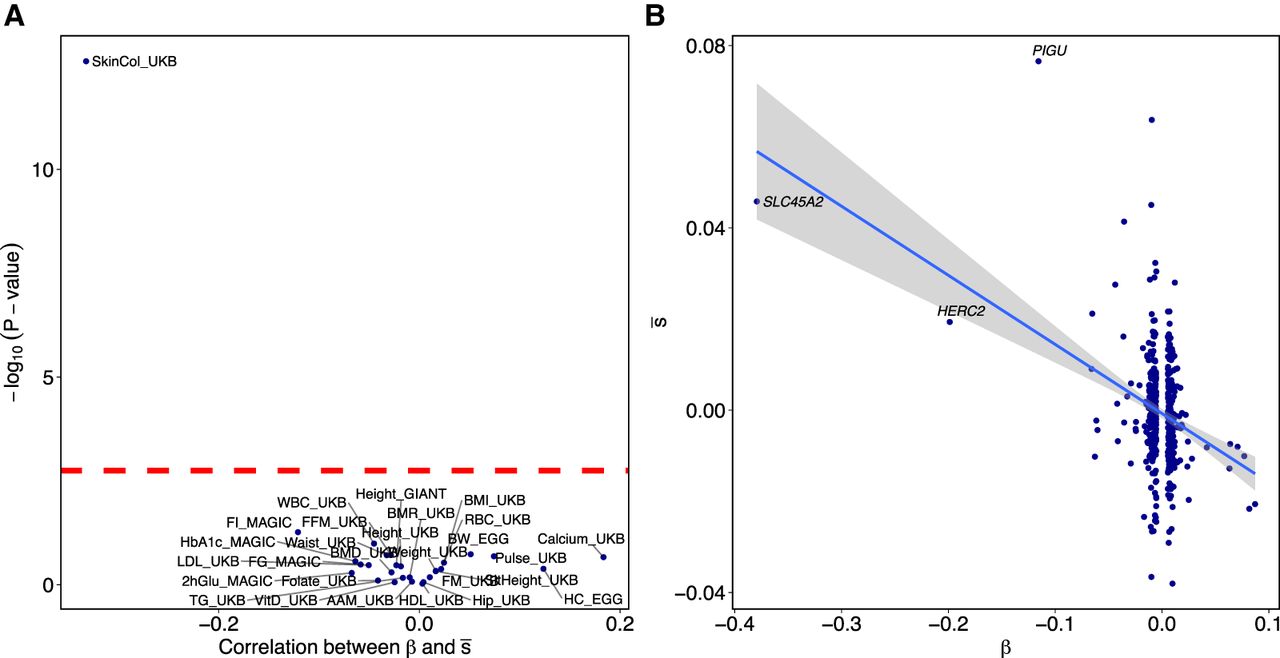
Evidence of polygenic selection. (A) Each point represents a single GWAS. The x-axis gives the (Pearson) correlation between effect size estimates, β, and selection coefficient estimates,  , for independent SNPs with GWAS P-value < 10−4 and minor allele frequency (MAF) > 5%. The y-axis gives the log10 (P-value) for null hypothesis of no correlation. Abbreviations, exact values, and sources are given in Supplemental Table S1. (B) Effect sizes and selection coefficient estimates for independent skin color–associated SNPs in the UK Biobank with GWAS
P-value < 10−4 and MAF > 5%. If the three labeled large-effect SNPs are removed, the correlation is weaker but still significant (ρ = −0.20,
P = 1.5 × 10⁻⁵).
, for independent SNPs with GWAS P-value < 10−4 and minor allele frequency (MAF) > 5%. The y-axis gives the log10 (P-value) for null hypothesis of no correlation. Abbreviations, exact values, and sources are given in Supplemental Table S1. (B) Effect sizes and selection coefficient estimates for independent skin color–associated SNPs in the UK Biobank with GWAS
P-value < 10−4 and MAF > 5%. If the three labeled large-effect SNPs are removed, the correlation is weaker but still significant (ρ = −0.20,
P = 1.5 × 10⁻⁵).


