
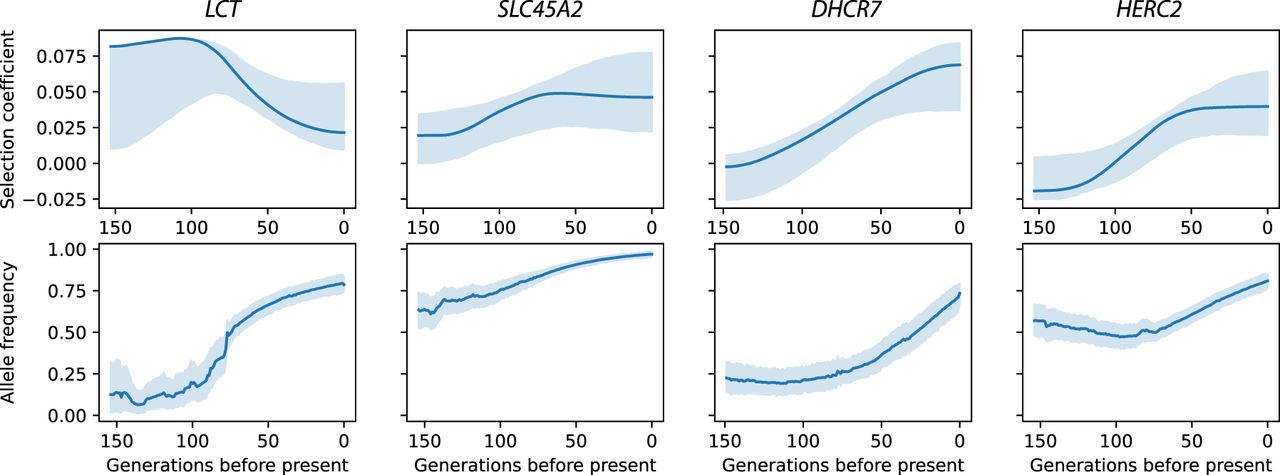
Figure 5.
Trajectories of genome-wide significant non-HLA loci. Solid lines show the inferred selection coefficient and trajectory of the lead SNP given in Table 1. Shaded areas show 95% credible intervals based on resampling of the allele frequency trajectories and observations. (Top) Estimated selection coefficients. (Bottom) Estimated allele frequency trajectories.


