
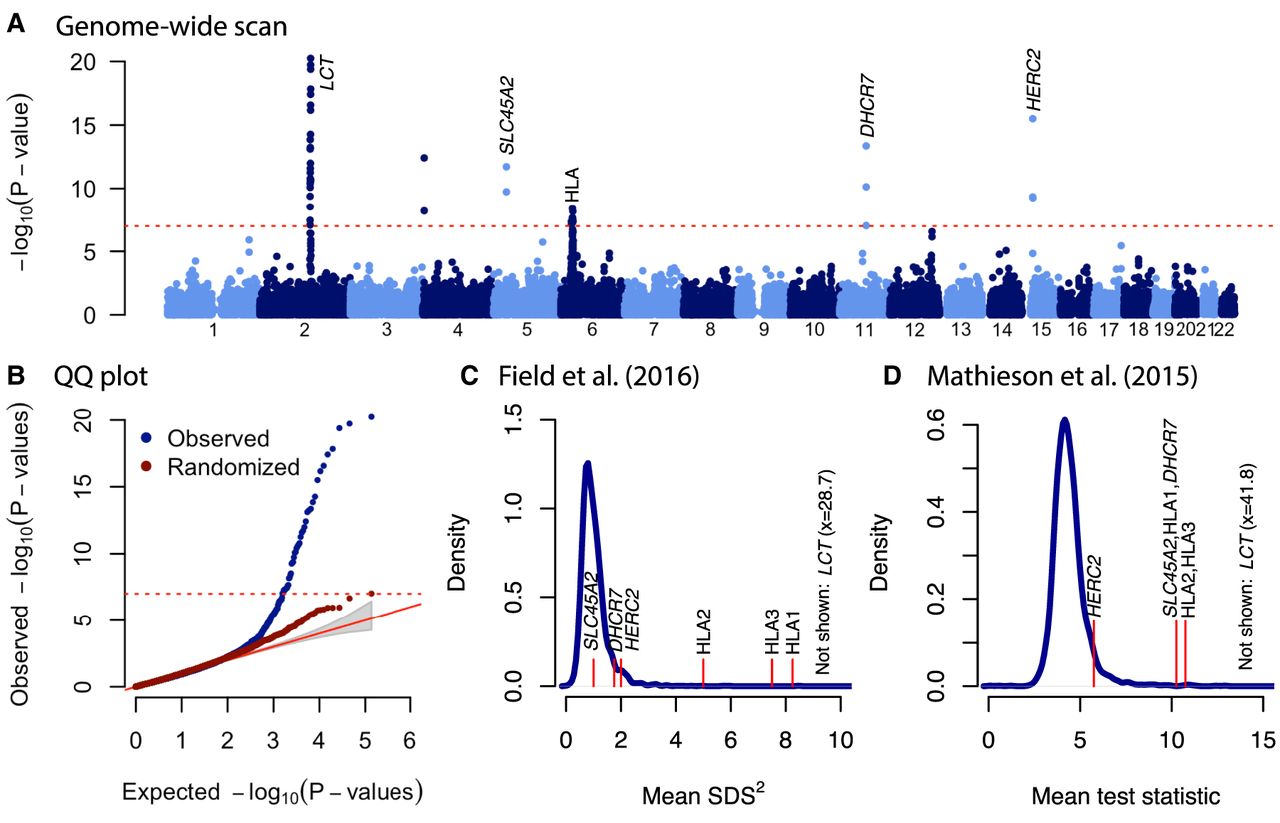
Genome-wide scan for selection in Britain. (A) P-values for selection in 20-SNP sliding windows. Genome-wide significant (P < 10−7) windows are labeled with the closest gene or known target of selection. (B) QQ plot for observations in A (blue) and after randomizing the dates of each sample (red). (C) Comparison with results of Field et al. (2016). Blue solid line shows the density of mean SDS2 in 20-SNP windows. Labeled red lines indicate windows that are genome-wide significant in our analysis. (D) Comparison with results of Mathieson et al. (2015). Blue solid line shows the density of mean  statistic in 20-SNP windows. Labeled red lines indicate windows that are genome-wide significant in our analysis. In both
C and D, HERC2 is approximately at the upper fifth percentile of the distribution.
statistic in 20-SNP windows. Labeled red lines indicate windows that are genome-wide significant in our analysis. In both
C and D, HERC2 is approximately at the upper fifth percentile of the distribution.


