
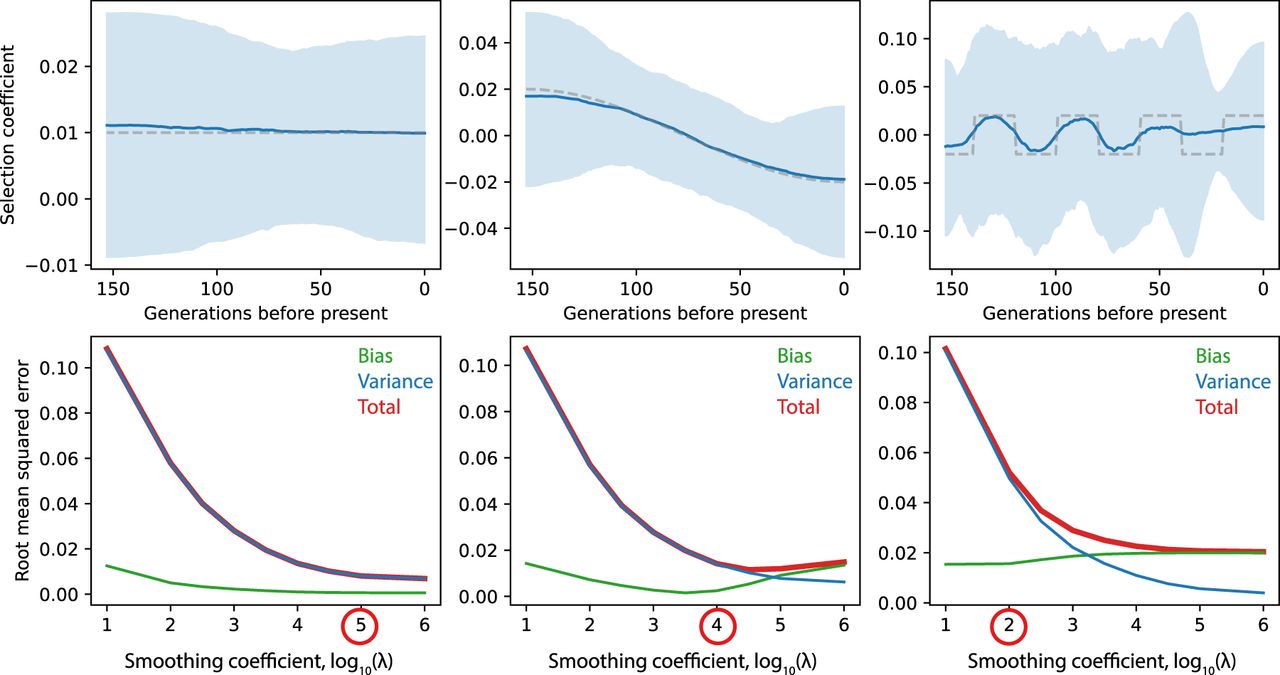
Figure 3.
Simulation results for the sampling distribution of the ancient British data. Each column shows a different selection coefficient trajectory. (Top) Estimated selection coefficients. Dashed line indicates simulated selection coefficient; solid blue line, mean selection coefficient from 1000 simulations; and light blue shaded area, region containing point estimates from 950/1000 simulations. (Bottom) Square root of squared bias, variance, and total squared error as a function of log10(λ). The circled value is the one used for the estimates in the top row.


