
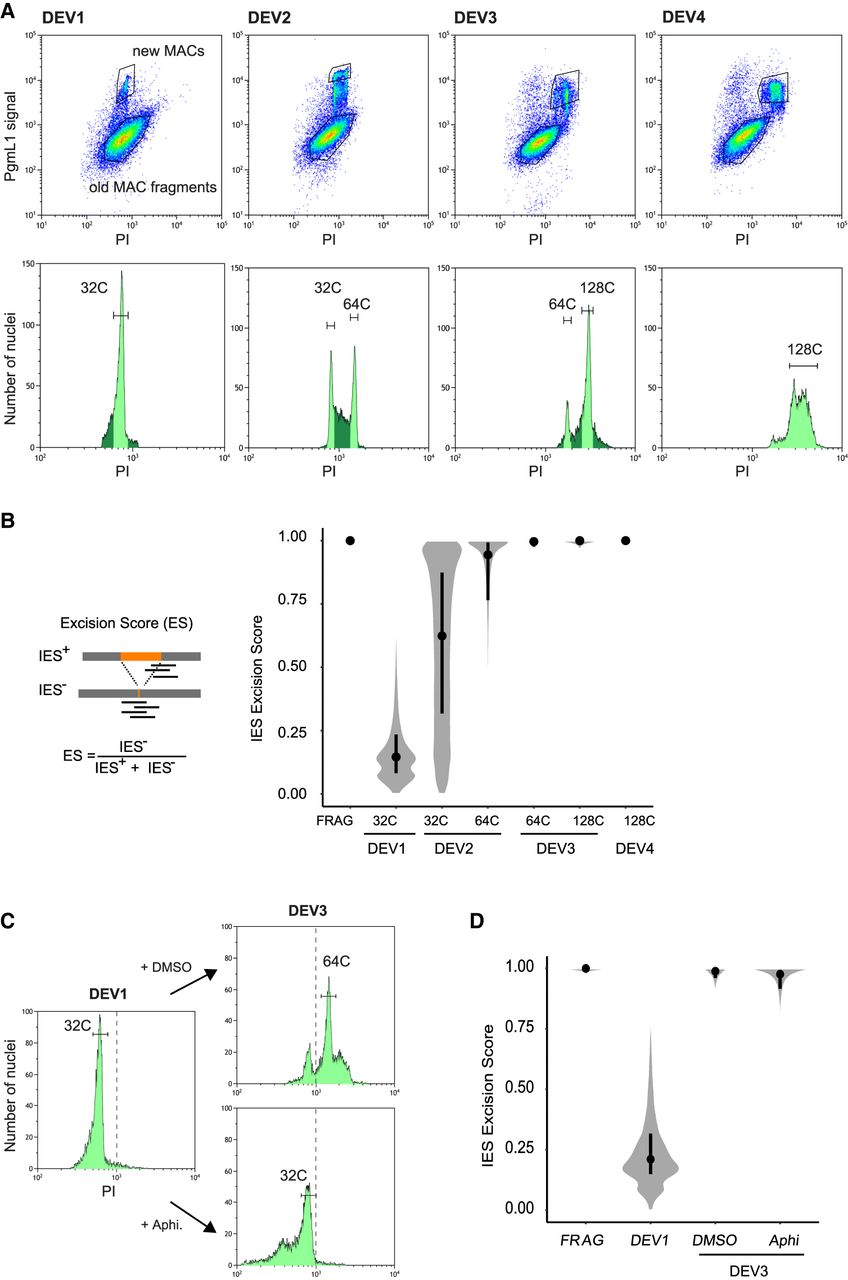
IES excision kinetics and endoreplication. (A) Flow cytometry sorting of nuclei during the different stages of an autogamy time course (tc4). (Upper panels) Plots of PgmL1 fluorescence intensity (y-axis) versus PI fluorescence intensity (x-axis) for nuclei collected at different developmental stages. (Lower panels) Histograms of PI-stained nuclei gated in the upper panel. Sorted new MAC peaks are indicated by light green shading. The estimated C-level for each sorted peak is indicated above. For DEV4 nuclei, the whole PgmL1-labeled population was sorted (light green), but the major peak was used for calculation of the C-level. As a control, old MAC fragments were sorted from the DEV1 stage. (B) Distribution of IES excision scores (ESs) in the different sorted new MAC populations. Samples are named according to the developmental stage (DEV1 to DEV4 from tc4) and the C-level of the sorted population. A schematic representation of the IES+ and IES− Illumina sequencing reads that were counted to calculate the ES is presented on the left. An ES of zero or one corresponds to no or complete IES excision, respectively. The black dot is the median, and the vertical black line delimitates the second and third quartiles. (C) Flow cytometry sorting of nuclei following aphidicolin treatment. PI histograms of PgmL1-labeled nuclei are presented for each stage or condition (DEV1, DEV3 DMSO, and DEV3 Aphi). The C-level for the indicated peaks was estimated as described in Supplemental Table S1. For each stage, all PgmL1-labeled nuclei were sorted. Old MAC fragments were sorted as a control from the DEV3 DMSO nuclear preparation. The dotted line is indicative of a PI value of 103. (D) ES distribution in the sorted new MAC populations in the aphidicolin time course. Sample names correspond to the sorted samples shown in C.


