
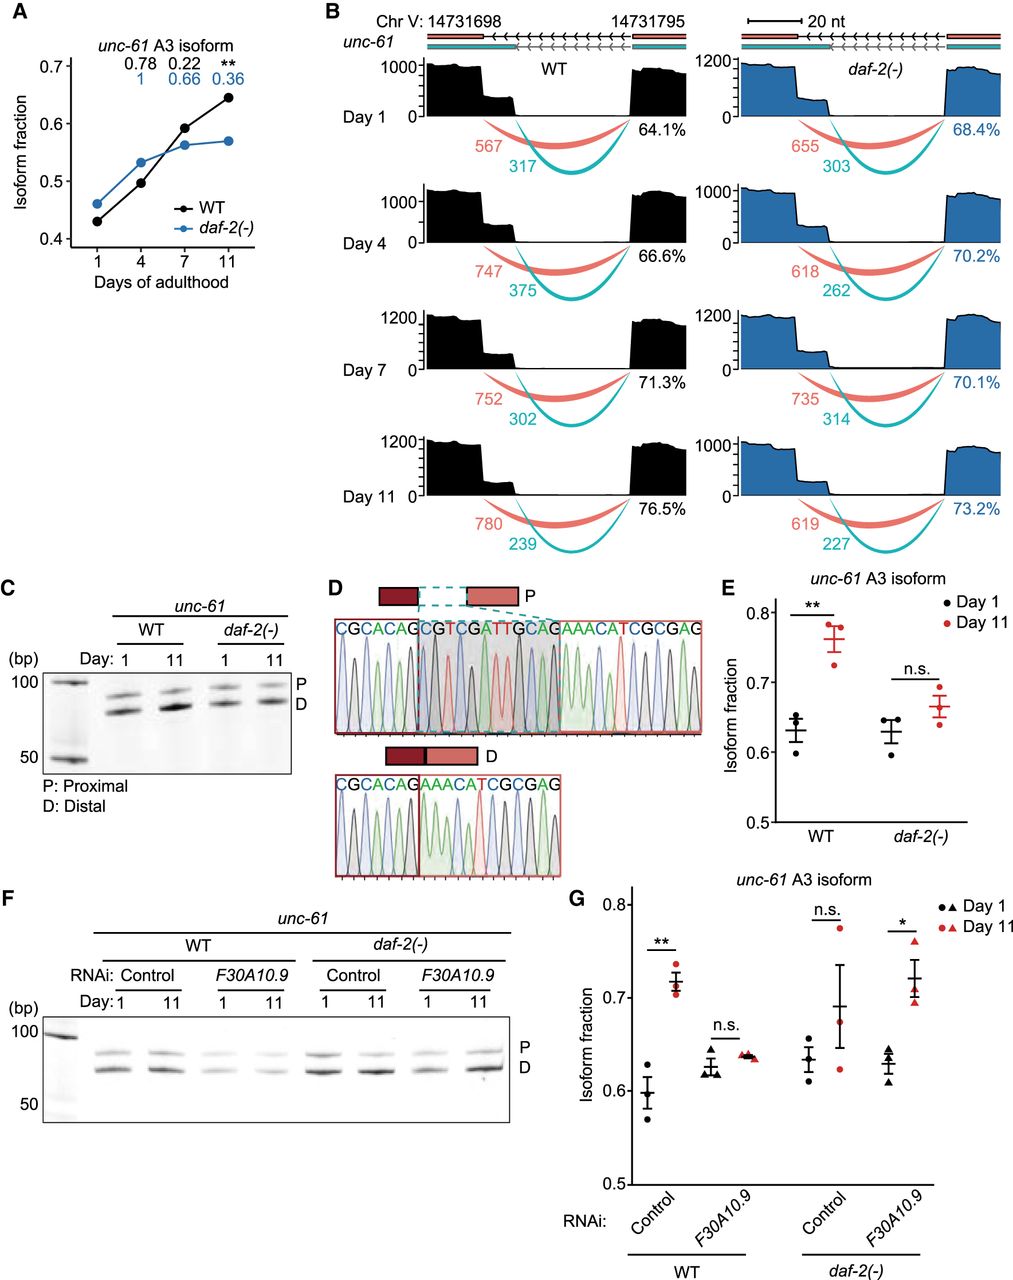
daf-2 mutations slow age-dependent increases in the usage of distal 3′ splice sites in unc-61. (A) Changes in isoform fraction of unc-61 A3 isoforms during aging in wild-type (WT) and daf-2(e1370) [daf-2(-)] animals. Adjusted P values are shown on top of the data points, calculated relative to day 1 of adulthood data using IsoformSwitchAnalyzeR; (**) adjusted P < 0.01. (B) Aligned reads (top) and junction usage (bottom) of unc-61 (Chr V: 14,731,698–14,731,795) A3 isoforms in WT and daf-2(-) animals at indicated ages. Pink lines represent junctions with distal 3′ splice sites, whereas cyan lines represent those with proximal 3′ splicing sites. Numbers below the lines indicate the numbers of reads aligned at the junctions. Percent numbers represent the ratios of reads at junctions with distal 3′ splicing sites to total reads at junctions with proximal and distal 3′ splicing sites. (C) RT-PCR analysis of the proximal (P) and distal (D) splice sites of unc-61 isoforms at days 1 and 11 of adulthoods. (D) Sequences and electropherograms of the RT-PCR amplicons of unc-61 isoforms. (E) Isoform fraction of unc-61 A3 isoforms that were obtained from three independent RT-PCR experiments. Error bars represent standard error of the mean (SEM). P values were calculated by two-tailed Student's t-test relative to day 1 of adulthood data; (**) P < 0.01, n.s.: not significant. (F) RT-PCR analysis of the P and D splice sites of unc-61 isoforms at days 1 and 11 of adulthoods in control RNAi- and F30A10.9 RNAi-treated animals. (G) Isoform fraction of unc-61 A3 isoforms that were obtained from three independent RT-PCR experiments. Error bars represent standard error of the mean (SEM). P values were calculated by two-tailed Student's t-test relative to day 1 of adulthood data; (*) P < 0.05, (**) P < 0.01, and n.s.: not significant. See Supplemental Source files for statistical analysis of the RT-PCR data shown in this figure and Supplemental Table S4 for primer sequences used in this RT-PCR.


