
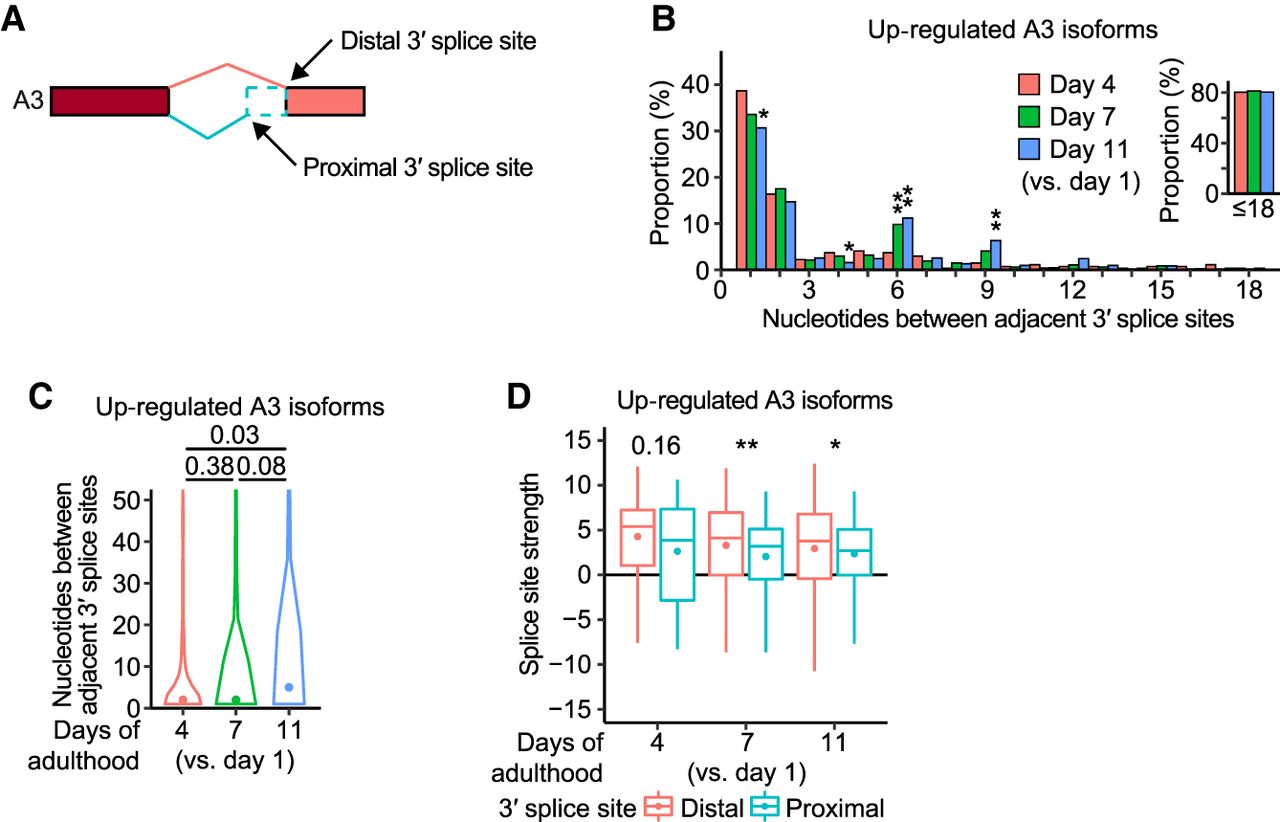
Aging increases the usage of distal optimal 3′ splice sites over proximal suboptimal 3′ splice sites in transcript isoforms. (A) Proximal and distal 3′ splice sites for alternative 3′ splice site (A3) isoforms. (B) Nucleotides between adjacently located proximal and distal 3′ splice sites in age-dependently up-regulated A3 isoforms. Inset: Proportion of the cases for which adjacent 3′ splice sites are located within 18 nt. P values are shown at the top of the bars, calculated by two-tailed Fisher's exact test; (*) P < 0.05, (**) P < 0.01. (C) Distribution of nucleotides between adjacent 3′ splice sites in age-dependently up-regulated A3 isoforms. P values are shown at the top of the data points, calculated using two-tailed Wilcoxon rank-sum exact test. (D) Splice site strength of proximal and distal 3′ splice sites in age-dependently up-regulated A3 isoforms. The strength was calculated based on a maximum entropy model. P values are indicated at the top of the data points, calculated using two-tailed Wilcoxon rank-sum exact test; (*) P < 0.05, (**) P < 0.01. See Supplemental Figure S4 for additional sequence analyses of the 3′ splice sites.


