
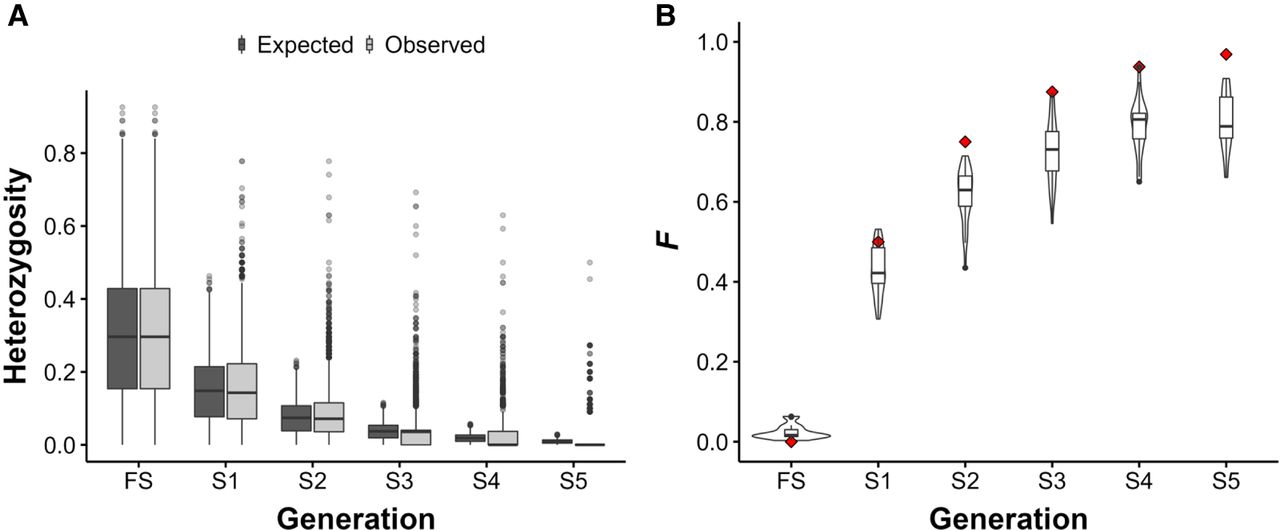
Change in heterozygosity (H) and inbreeding coefficients (F) over five successive generations of complete selfing in WRC. (A) Observed versus expected change in heterozygosity over five successive generations of complete selfing in n = 28 (FS–S4) and n = 11 (S5) different selfing lines (SLs), at n = 18,371 SNP loci, after manual error correction. Each line at each generation is represented by a single tree. Black points indicate boxplot outliers. Observed median heterozygosity declines faster than expected under theoretical expectations during complete selfing, despite many SNP loci remaining heterozygous across all generations. (B) Inbreeding coefficients (F) for n = 28 samples (FS–S4) and n = 11 samples (S5). Black points indicate boxplot outliers. Under complete selfing, F is expected to increase by a factor of ½(1 + F) in the previous generation (red diamonds). F increases at a slower rate than expected in our SLs.


