
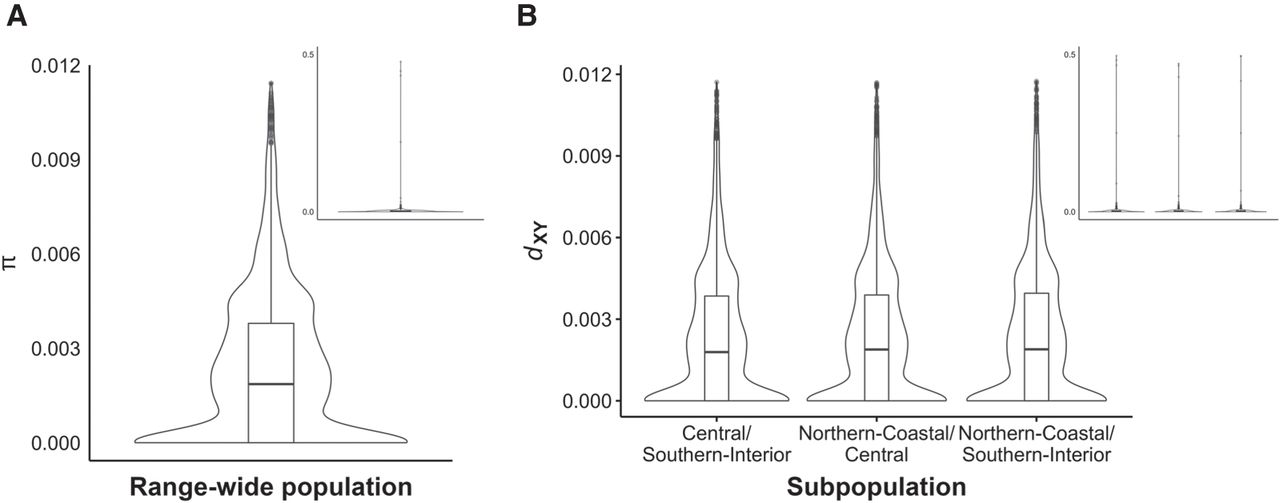
Average nucleotide diversity π and average nucleotide difference between subpopulations in the RWP. (A) Overall distribution of average π of the RWP in SCOs. We detected 1411 SCOs with a π of zero, with an average π of 0.00272. (B) Overall distribution of average dXY between each pair of geographic subpopulations. No significant nucleotide differences were observed between comparisons of different subpopulations. Inlays show all π estimates; main plots show π estimates with outliers in the top one percentile removed for clarity. The top 1% of π estimates accounts for 3% of the total estimated diversity, and the top 5% accounts for over 13% of the total.


