
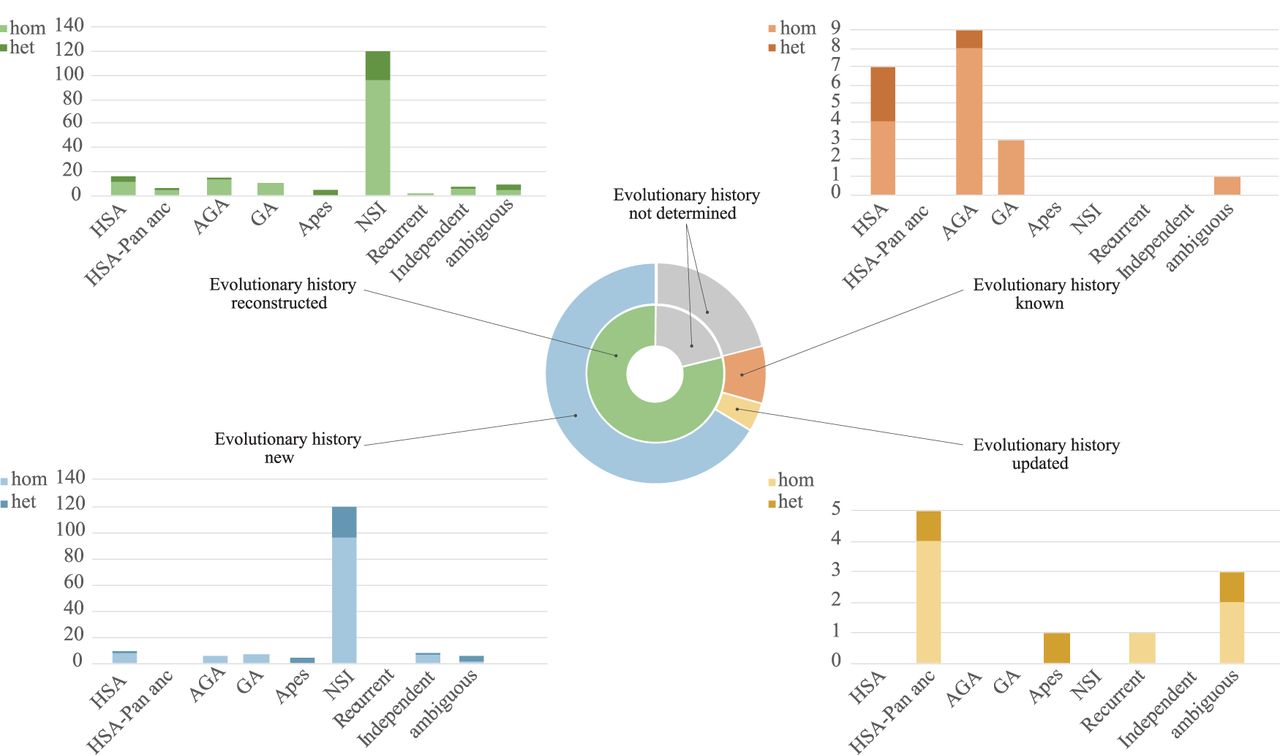
Figure 2.
Evolutionary history of inversions. The pie chart in the middle reports a summary of the evolutionary analyses for all the inversions detected by Strand-seq. The four histograms report the number of inversions that occurred in each lineage, with detail on what was already known from previous literature and what has been determined for the first time in the present study.


