
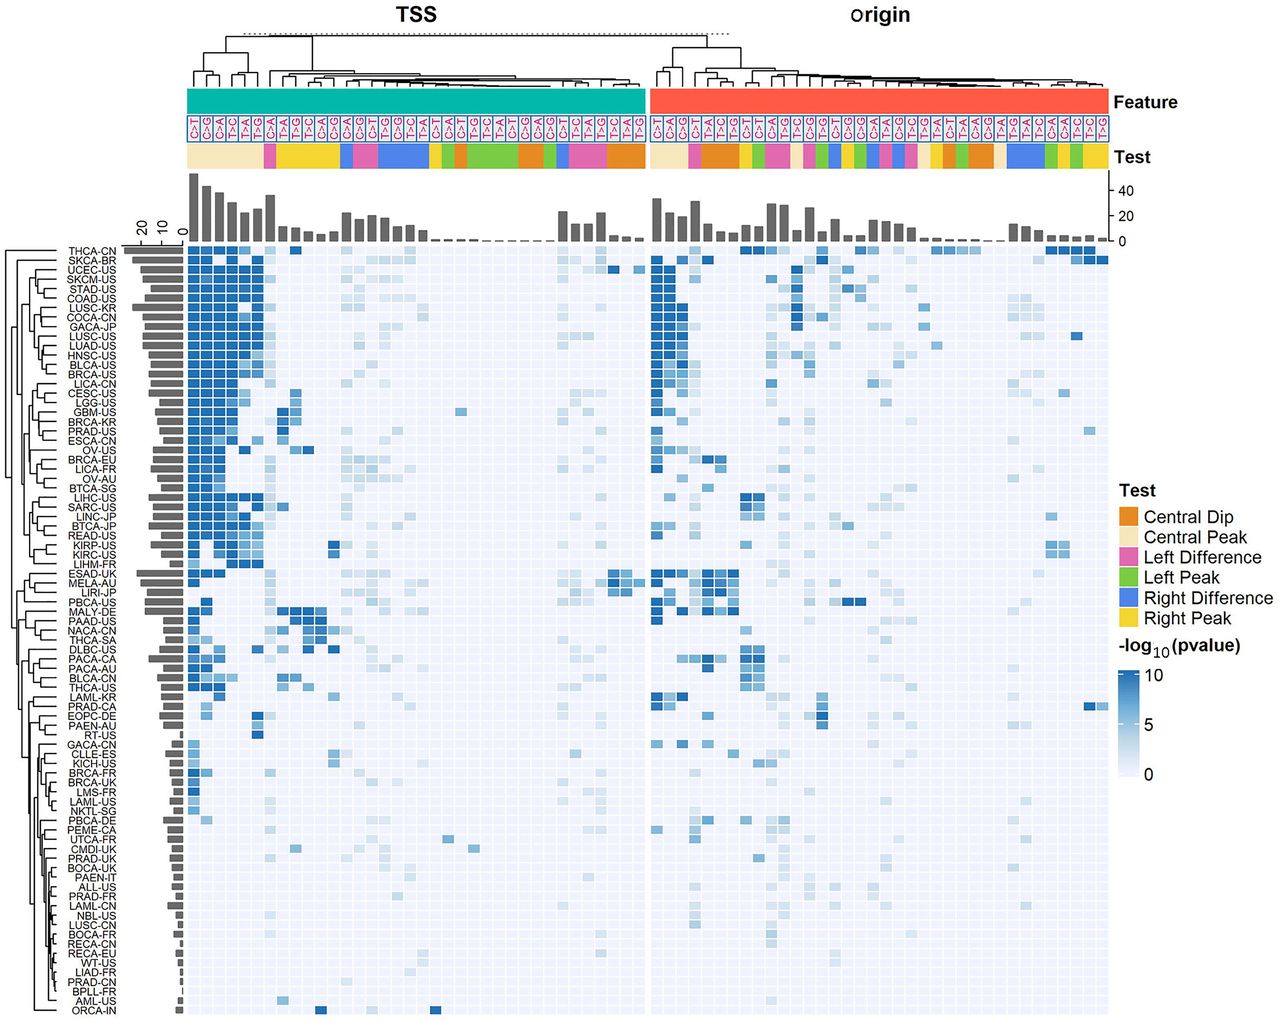
Figure 3.
Overview of MutDens bulk analyses across all ICGC cohorts and all six mutational classes. Rows designate 81 ICGC cancer cohorts, and columns designate a total of 72 tests within each cancer cohort, concerning TSS and replication origin. The 72 tests per cohort differed by focal genomic feature (Feature), mutational class, and specific test objective (Test). Intensity in the heatmap is proportional to the inverse P-value (−log10(P)). All insignificant P-values (P > 0.01 for density difference tests and P > 1 × 10⁻⁵ for peak/dip tests) were treated as P = 1 and hence shown in the dimmest color.


