
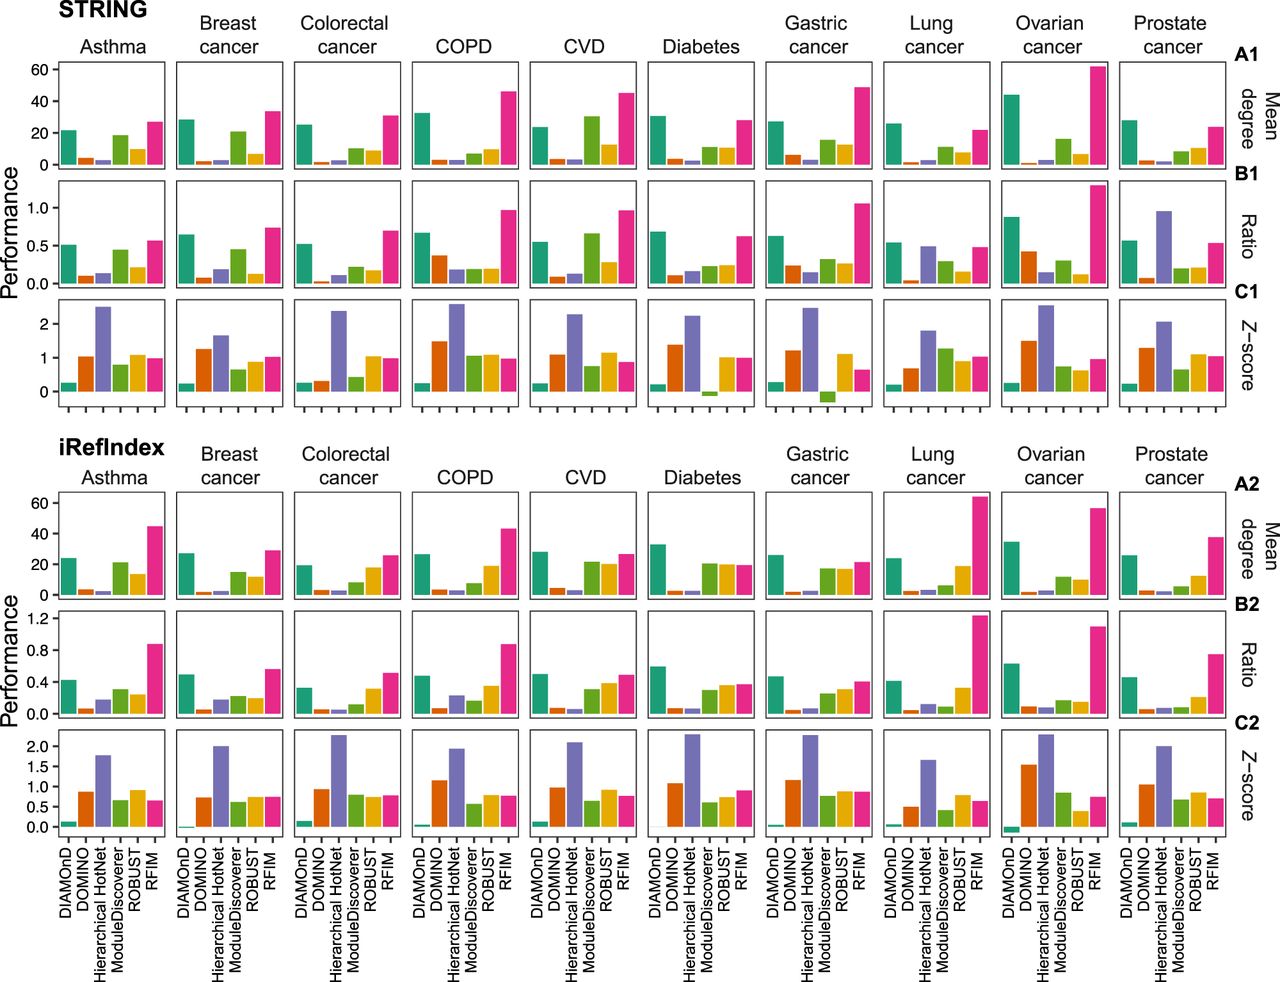
Connectivity comparison of the disease modules obtained by different methods and different phenotypes. We applied each disease module detection method in the genome-wide association studies (GWAS) of each disease separately and compared (A) the mean degree of genes in the disease module; (B) the ratio between the average degree of the disease module and that of the nodes that directly interact with the disease module nodes; (C) and statistical significance of the size of the disease module's largest connected component (LCC), with respect to LCCs of randomly sampled proteins of the same size as the disease module. Z-score is calculated from 1000 degree preserving randomizations.


