
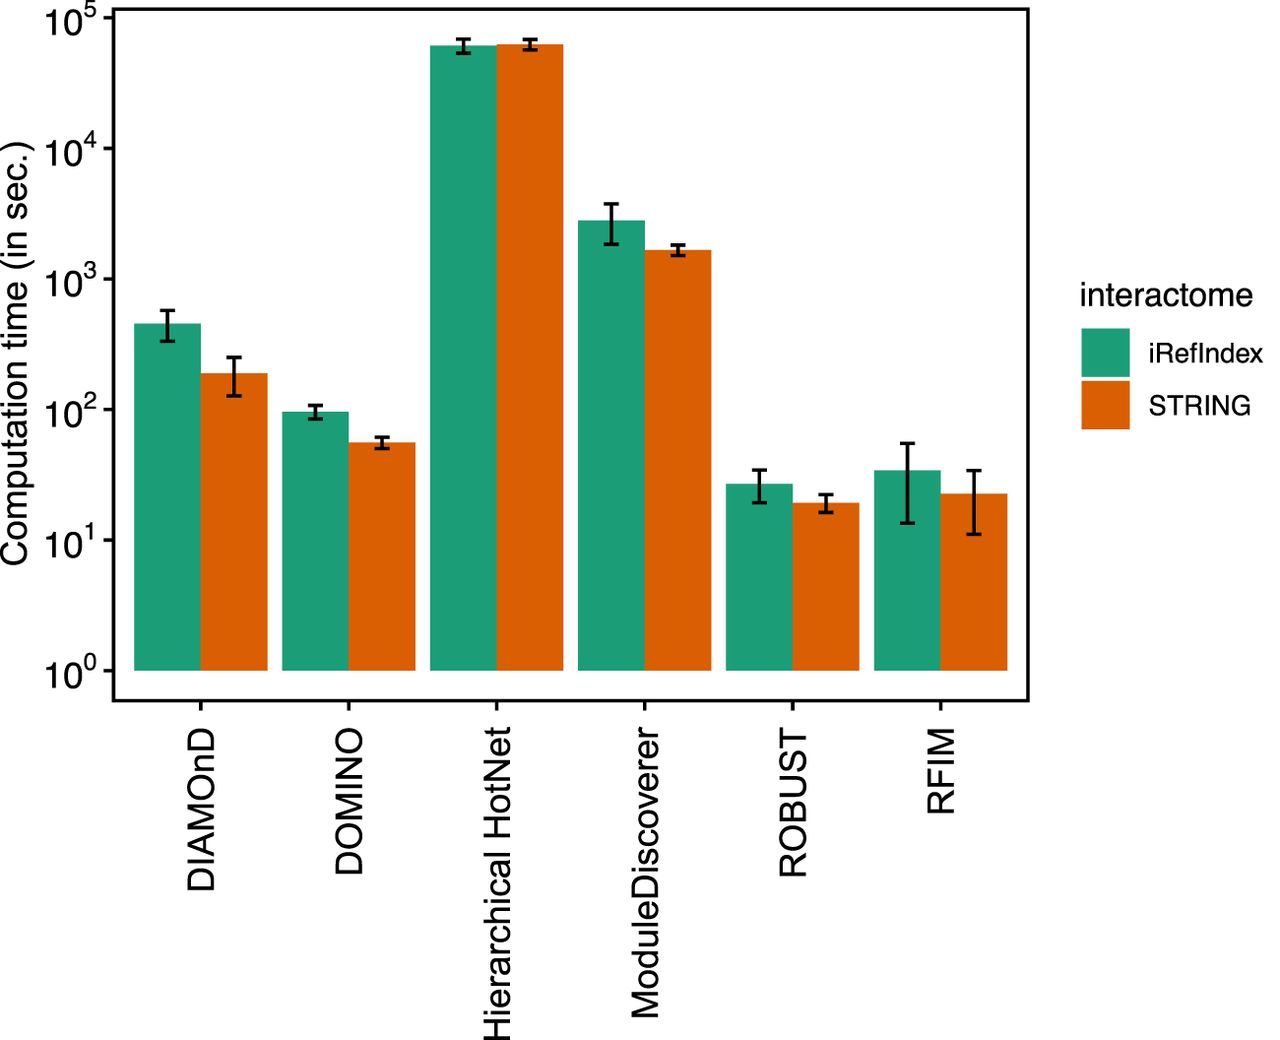
Figure 2.
Computational complexity of each disease module detection method. Each bar represents the average computation time (in seconds) overall all ten phenotypes. Error bar represents the standard derivation among 10 GWAS data sets. The computation time is measured as the running time on macOS machine with 2.4 GHz 8-Core Intel Core i9 processor. Hierarchical HotNet was paralleled using four cores.


