
Abstract
Emerging spatial profiling technology has enabled high-plex molecular profiling in biological tissues, preserving the spatial and morphological context of gene expression. Here, we describe expanding the chemistry for the Digital Spatial Profiling platform to quantify whole transcriptomes in human and mouse tissues using a wide range of spatial profiling strategies and sample types. We designed multiplexed in situ hybridization probes targeting the protein-coding genes of the human and mouse transcriptomes, referred to as the human or mouse Whole Transcriptome Atlas (WTA). Human and mouse WTAs were validated in cell lines for concordance with orthogonal gene expression profiling methods in regions ranging from ∼10–500 cells. By benchmarking against bulk RNA-seq and fluorescence in situ hybridization, we show robust transcript detection down to ∼100 transcripts per region. To assess the performance of WTA across tissue and sample types, we applied WTA to biological questions in cancer, molecular pathology, and developmental biology. Spatial profiling with WTA detected expected gene expression differences between tumor and tumor microenvironment, identified disease-specific gene expression heterogeneity in histological structures of the human kidney, and comprehensively mapped transcriptional programs in anatomical substructures of nine organs in the developing mouse embryo. Digital Spatial Profiling technology with the WTA assays provides a flexible method for spatial whole transcriptome profiling applicable to diverse tissue types and biological contexts.
The organization of tissues and organs is complex and spatial relationships between cells and structures are key to their development, homeostasis, and pathophysiology. Recently, several methods have emerged for multiplexed spatial profiling of RNA or proteins, leading to discoveries in oncology, infectious disease, developmental biology, and other fields (Desai et al. 2020; Merritt et al. 2020; Brady et al. 2021; Butler et al. 2021; Jerby-Arnon et al. 2021; Pelka et al. 2021; Rao et al. 2021; Rendeiro et al. 2021). Existing spatial gene expression platforms operate at a range of plex and with diverse profiling strategies. Sequencing-based methods capture transcripts in an unbiased manner and are capable of whole transcriptome coverage. For example, laser capture microdissection physically separates cells and structures of interest within a tissue, which can then be profiled by a variety of methods including RNA-seq (Emmert-Buck et al. 1996; Espina et al. 2006). Other sequencing-based methods such as Slide-Seq and Spatial Transcriptomics capture polyadenylated mRNAs across prepatterned barcoded spot arrays (Ståhl et al. 2016; Vickovic et al. 2019; Stickels et al. 2021). An advantage of these methods is that they provide unbiased coverage of the transcriptome. However, one disadvantage is that RNA-seq via poly(A) capture can be dominated by highly expressed genes.
Imaging-based spatial profiling methods, such as multiplexed error-robust fluorescence in situ hybridization (MERFISH), fluorescent in situ sequencing (FISSEQ), and sequential barcoded fluorescence in situ hybridization (seqFISH) (Chen et al. 2015; Lee et al. 2015; Xia et al. 2019), use rounds of sequential hybridization and imaging to resolve transcripts at single-cell or subcellular resolution. Some imaging methods have shown detection of up to 10,000 targets, but most experiments have been limited to lower plex in the hundreds of targets (Eng et al. 2019; Xia et al. 2019).
Digital Spatial Profiling (DSP) is a platform for multiplexed spatial RNA and protein expression profiling in user-defined regions of interest (Merritt et al. 2020). DSP relies on affinity reagents (probes for RNA and antibodies for protein detection) attached to indexing oligonucleotide tags with a UV-photocleavable linker. The affinity reagents are hybridized to a slide-mounted tissue sample that is also stained with fluorescent antibodies or probes to identify features of interest. The tissue is imaged using fluorescence microscopy and UV light is projected onto the region to be profiled, called areas of illumination (AOIs), to release the oligo tags. The liberated tags are collected and counted using the nCounter system or by high-throughput sequencing. In the first demonstration of the DSP technology, 44 proteins and 84 transcripts were multiplexed using nCounter, and 1412 transcripts were profiled by high-throughput sequencing readout (Merritt et al. 2020).
Here, we report the expansion of the DSP RNA profiling technology to measure the expression of >99.5% and >98.2% of protein-coding genes of the human or mouse transcriptome, respectively, to create the human and mouse Whole Transcriptome Atlases (WTAs). In this study, we aim to evaluate the technical performance of human and mouse WTA across a range of sample types, region sizes, and profiling strategies, and show applications in diverse normal and diseased tissue types.
Results
Design of multiplexed probes targeting the human and mouse whole transcriptomes
WTA consists of species-specific in situ hybridization (ISH) probes designed to target the protein-coding genes of the human or mouse transcriptome. Each probe contains three functional regions: an RNA-targeting region, a UV-photocleavable linker, and an indexing sequence (Supplemental Fig. S1). The indexing sequence contains a unique molecular identifier (UMI), a barcode sequence that identifies the probe, and primer-binding sequences for amplification and subsequent readout by standard Illumina sequencing workflows. The probe identification barcodes were designed to have a minimum Hamming distance of ≥2 between barcodes.
We designed 18,815 human and 20,175 mouse probes targeting >99.5% of annotated protein-coding genes in human and >98.2% in mouse (Supplemental Table S1). To reduce sequencing requirements and optimize readout efficiency, probes targeting mitochondrially encoded genes and an additional 10 human and two mouse highly expressed nuclear-encoded genes were removed (see Supplemental Methods). Mouse WTA also includes probes targeting 17 commonly used transgenes. We additionally designed 139 negative control probes in human WTA and 210 negative control probes in mouse WTA against synthetic sequences from the External RNA Controls Consortium (ERCC) set (The External RNA Controls Consortium 2005). The ERCC sequences have the same properties as mammalian sequences but without similarity to any known transcripts.
RNA-targeting regions are 35–50 nucleotides and were selected based on an iterative design process that considers thermodynamic profile, splice isoform coverage, potential for cross-hybridization with other transcripts, and potential for intramolecular interactions between probes (see Methods). Probes were synthesized individually and pooled, and the pools were sequenced to ensure that 100% of designed probes were present and that the coefficient of variation of probe concentration was <20%.
As WTA contains a single probe per gene, we assessed the consequences of this design choice by comparing human WTA with a smaller probe pool targeting 1812 human genes with five probes per target. In matched 200 μm AOIs in formalin-fixed paraffin embedded (FFPE) tonsil tissue, counts from the single WTA probe were well correlated to the mean count of the five probes for the same target (median R = 0.83), as well as a randomly selected single probe (median R = 0.73) (Supplemental Fig. S2A). These results validate that a single probe is sufficient to accurately quantify gene expression.
WTA data are reproducible and well correlated with RNA-seq and RNA FISH in cell lines
We first benchmarked the performance of the human and mouse WTAs in homogeneous FFPE cell pellet arrays (CPAs) to test reproducibility and compare to orthogonal methods of measuring gene expression. DSP allows flexible selection of AOIs, and profiled regions can range from less than ten cells to thousands of cells. As there is a trade-off between the number of cells profiled and signal, we benchmarked the performance of WTA in 50–400-μm-diameter circular AOIs in human and mouse FFPE CPAs (Fig. 1A). In cell pellets, 50-μm-diameter AOIs contained an average of 12 cells in human cell lines and 13 cells in mouse cell lines, whereas 400-μm-diameter AOIs contained an average of 480 cells in human and 505 cells in mouse. For both human and mouse WTAs, counts were highly reproducible between two independent experiments for all cell lines and AOI sizes tested (R = ∼0.75 for 50 μm AOIs, and R = ∼0.95 for 400 μm AOIs) (Fig. 1B).
Human and mouse WTA data are reproducible and correlated with RNA-seq and RNA FISH. (A) Representative image of the areas of illumination (AOI)-size titration experiment. Circular AOIs 50 μm, 200 μm, and 400 μm in diameter were placed on each cell line of an 11-core human or mouse formalin-fixed paraffin embedded (FFPE) cell pellet array (human shown, stained with antibodies against CD3E, PTPRC, and pan-cytokeratin [PanCK], and SYTO13 nuclear stain). (B) Reproducibility of WTA counts from two replicate experiments. Left: Scatterplots of log10-transformed raw counts from one representative human (HUT78) or mouse (3T3) cell line at each AOI size from each replicate. Negative control probes are shown in blue and target probes in black. Right: Pearson correlation coefficients of log10-transformed raw counts between replicates for each cell line and AOI size. (C) Left: Scatterplots of WTA counts versus RNA-seq TPM from the same cell line for one representative human or mouse cell line in a 200 μm AOI. Right: Spearman's correlation of WTA counts compared with RNA-seq of each cell line. For each AOI, the matching cell line is shown in blue and all other cell lines in gray. (D) Representative image of the cell line titration experiment. Cell pellets contained one cell line titrated into the other at a variable ratio. Cells were stained with RNAscope probes against two genes specifically expressed in one of the two cell lines. Gray circles show profiled AOIs. (E) Left: Representative scatterplot comparing WTA counts for MS4A1 to RNAscope fluorescence intensity for the same gene across cell pellets. Right: Spearman's correlation of WTA counts compared with RNA FISH fluorescence intensity for each gene profiled.
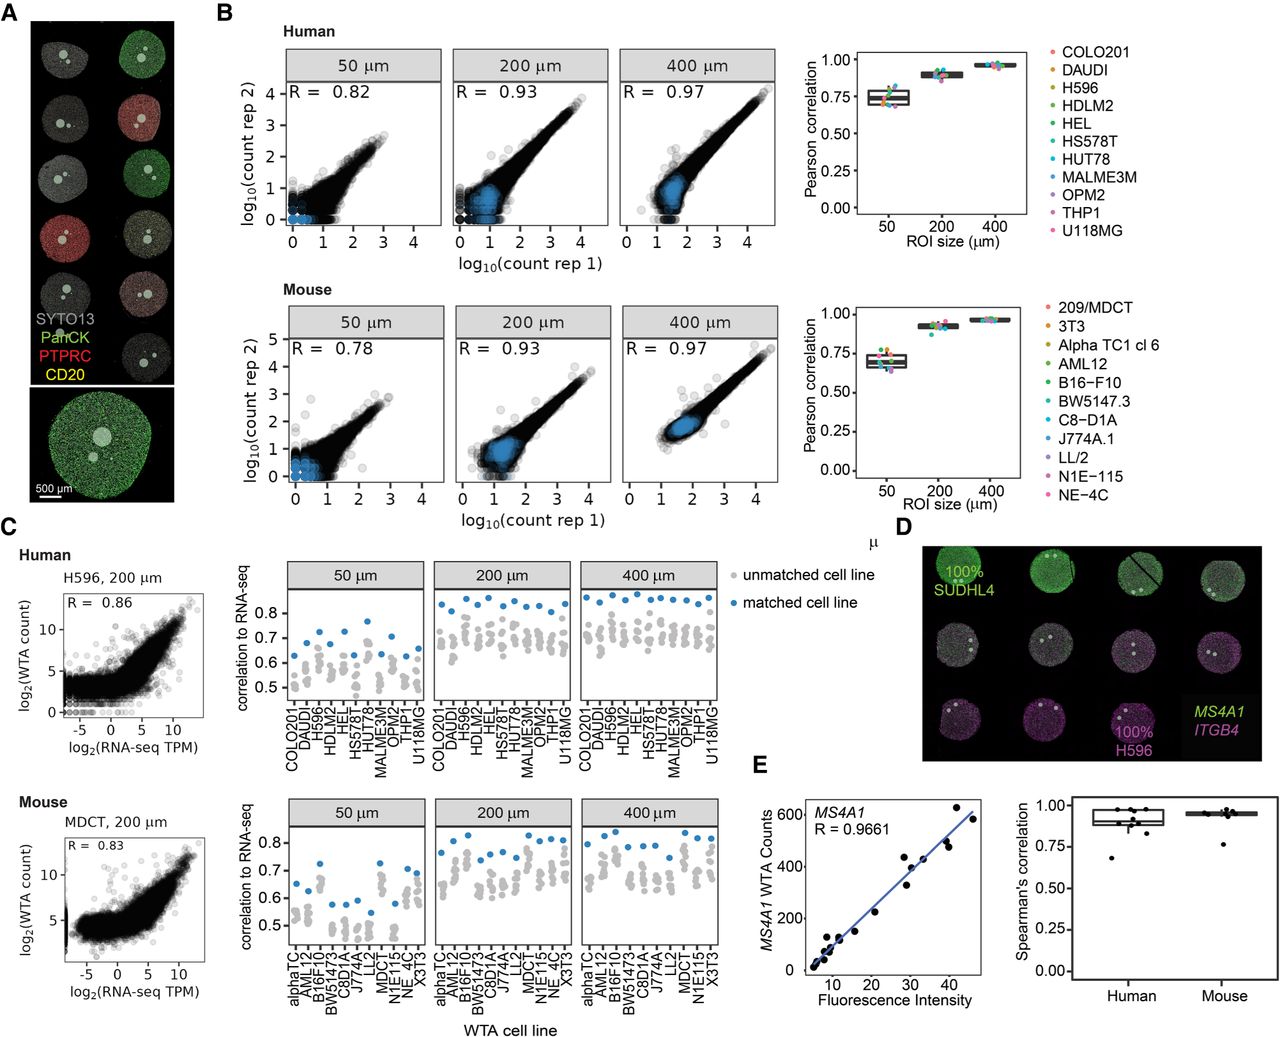
We next asked whether WTA results are concordant with bulk RNA-seq of cell lines. Bulk RNA-seq data were either generated for this study or acquired from publicly available data from the Cancer Cell Line Encyclopedia (Ghandi et al. 2019). Using all genes in the WTA panels, we found that the matched cell line had the highest correlation coefficient between WTA and RNA-seq for all cell lines and all AOI sizes. Correlation coefficients with the matching cell line were ∼0.7 in 50-μm-diameter AOIs and increased to >0.8 in 400-μm-diameter AOIs, and were similar for human and mouse WTAs (Fig. 1C). To test the effect of gene expression level on correlation to RNA-seq, we compared WTA counts to RNA-seq subset to the lowest and highest quartile of expressed genes (genes > 1 transcript per million [TPM] in the RNA-seq). For the most highly expressed genes, the matched cell line retained the highest correlation for all but one cell line at all AOI sizes. For the lowest expressed genes, the matched cell line had the highest correlation in 200 µm and 400 µm AOIs, but discrimination between cell lines was reduced in 50 µm AOIs (Supplemental Fig. S2B), suggesting that very low expressed genes are not as well quantified in very small AOIs.
We next tested whether WTA could accurately quantitate gene expression. For these experiments, we used a mixed-proportion FFPE (human) or fixed frozen (mouse) CPA with one cell line titrated into another in 10% increments. We selected nine human genes and eight mouse genes that are highly expressed in one cell line (>100 TPM in bulk RNA-seq) and not expressed in the other (<1 TPM in bulk RNA-seq) (Supplemental Fig. S3A), which creates a gradient of gene expression levels from low to high across the cell pellets. For each gene, WTA signal was compared with FISH signal using RNAscope probes (Fig. 1D; Wang et al. 2012). WTA and FISH signals were highly correlated for all genes, with an average Pearson correlation coefficient of 0.90 for human and 0.93 for mouse (Fig. 1E; Supplemental Fig. S3). These results indicate that WTA can accurately quantify gene expression across the biological range of gene expression.
Sensitivity, specificity, and limit of detection of WTA in different sized AOIs
We next investigated WTA's sensitivity and specificity in different sized AOIs using CPAs. We used the distribution of signal from the negative control probes to determine the background level of nonspecific binding and set a limit of detection (LOD) specific to each AOI. Counts from individual negative probes are moderately correlated between replicate experiments, suggesting that the variance in negative probe signal is caused by both sequence-specific and nonspecific effects (Supplemental Fig. S4A). Target and negative probe counts increase with AOI area and scale with each other in different cell lines (Supplemental Fig. S4B), highlighting the importance of empirically measuring the nonspecific background for each AOI.
To determine a cutoff for calling a gene expressed, we calculated sensitivity and specificity at different LOD thresholds using genes with RNA-seq TPM > 1 as the true set of expressed genes. Discrimination between true and false positives improves with increasing AOI size for both human and mouse WTA (Fig. 2A). We found that selecting an LOD threshold of 2 standard deviations above the geometric mean of negative probes reliably achieves a specificity of >95% at all ROI sizes in both panels. At this LOD threshold, sensitivity was 50% in 50-μm-diameter AOIs, 68% in 200 μm AOIs, and 81% in 400 μm AOIs for human WTA, and 48% in 50 μm AOIs, 66% in 200 μm AOIs, and 75% in 400 μm AOIs for mouse WTA. Overall, we detect an average of ∼6000 genes above background per AOI in 50 μm AOIs and ∼9000 genes in 400 μm AOIs (Fig. 2B).
WTA has high sensitivity and can detect genes at a range of expression levels depending on areas of illumination (AOI) size. (A) Left: Scatterplots comparing WTA counts to RNA-seq for one representative cell line at each AOI size, colored by whether the gene is detected above the expression threshold in each assay. Dashed lines indicate thresholds for calling a gene “expressed” as 2 standard deviations above the geometric mean of negative probes for WTA, and TPM > 1 for RNA-seq. TP, true positive; FP, false positive; TN, true negative; and FN, false negative. Right: Receiver-operator curves demonstrating the sensitivity and specificity of WTA at different WTA expression thresholds. (B) Number of genes per AOI above the expression threshold of 2 standard deviations above the mean negative probe count at each AOI size. (C) Representative images of the experiment to determine the sensitivity of human WTA relative to absolute transcript number. Left: RNAscope image of two genes in one cell line of the 20 genes in 11 cell lines quantified in this experiment. Right: Digital Spatial Profiling (DSP) image of one cell line with an AOI size titration. (D) Sensitivity of WTA at different AOI sizes for genes in different gene expression bins as measured by RNAscope. Genes ≥ 1 transcript per cell were considered expressed. Intervals are open on the left and closed on the right. (E) Sensitivity of WTA for genes binned by transcripts per AOI, calculated using transcripts per cell quantified by RNAscope and the number of cells in each AOI.

To determine the LOD of WTA relative to absolute transcript number, we integrated human WTA FFPE CPA data with RNAscope experiments in which we quantified the number of transcripts per cell for 20 genes in 11 cell lines (Fig. 2C; Supplemental Fig. S5). These genes spanned a range of expression levels across different cell lines, from a mean count of 0 to 45 transcripts per cell (corresponding to 0–1200 TPM in RNA-seq) (Supplemental Fig. S5). Gene expression levels measured by RNAscope were well correlated between replicate experiments and well correlated with RNA-seq for genes above 1 TPM. Below 1 TPM, all genes had a mean expression of less than 1 transcript per cell (Supplemental Fig. S5B).
WTA signal is linearly correlated with RNA-seq and RNAscope above a certain gene expression level, below which WTA does not detect signal (Fig. 2A; Supplemental Fig. S5). To identify this limit of quantitation relative to absolute transcript number, we performed breakpoint analysis, which iteratively fits two line segments to the data and calculates the breakpoint at which the model best fits the data. In 50-μm-diameter AOIs containing an average of 13 cells, we found that the breakpoint was ∼2 transcripts per cell. In larger AOI sizes with >50 cells, the breakpoint was 0.5–0.6 transcripts per cell (Supplemental Fig. S5), representing the lowest expression level that can be quantified by WTA.
We calculated WTA sensitivity and specificity in terms of absolute transcript number using genes with RNAscope counts of ≥1 transcript per cell as the true set of expressed genes. Specificity was 94%–97% for all AOI sizes (Supplemental Fig. S5). Highly expressed targets (>10 transcripts per cell) were detected with a sensitivity of >80% in 50-μm-diameter AOIs and 90%–100% in larger AOIs. On the other extreme, very lowly expressed targets (1–2 transcripts per cell) were detected with a sensitivity of ∼75% in AOIs with >500 cells and progressively less frequently detected in smaller AOIs (Fig. 2D). By combining the average number of transcripts per cell with the number of cells present in each AOI, we calculated sensitivity at different numbers of transcripts per AOI. At >100 transcripts per AOI, sensitivity was >70% (Fig. 2E). These results indicate that WTA can detect and quantify genes present at ∼100 transcripts per AOI in AOIs ranging from 10–500 cells.
WTA is compatible with multiple sample types and mouse strains
The initial demonstration of DSP technology used FFPE samples (Merritt et al. 2020). To expand the range of sample preparation types available for DSP, we designed and tested protocols for human fresh frozen (FF) and mouse fixed frozen (FxF) samples. To assess the performance of WTA on these additional sample types, we placed matched 200 μm-diameter circular AOIs on FFPE and FxF mouse CPAs and FFPE and FF human tonsil tissue. The correlation of WTA counts was >0.83 comparing FFPE to either FxF or FF, and the distribution of signal to background ratios across genes was similar between sample preservation types (Supplemental Fig. S6).
Specifically, for mouse WTA, we asked whether gene expression can be accurately quantified in mouse strains other than C57BL/6J, the reference transcriptome to which mouse WTA was designed. We profiled an FFPE tissue array consisting of seven different organs for each of three commonly used mouse strains (C57BL/6J, BALB/c, and NOD/ShiLt) (Supplemental Fig. S7). Although transcriptional differences exist between strains because of true biological variation, these differences are known to be minimal (Breschi et al. 2017). We placed 300-μm-diameter circular AOIs in similar regions of each tissue for each mouse strain and compared the results from each strain across organs. The transcriptomes were well correlated for all organs and pairs of strains (R = 0.7–0.95). Clustering by gene expression showed that organs clustered together before mouse strains, and gene expression patterns across tissues were similar in all three strains. These results suggest that mouse WTA can be used to characterize gene expression in these commonly used mouse strains.
WTA detects expected spatial gene expression differences between tumor and tumor microenvironment in a range of AOI sizes
One of the strengths of the DSP system is that users can define and segment a region of interest into multiple AOIs based on expression of antibody- or RNA FISH-based markers. This feature enables the ability to individually profile different tissue compartments even if they are spatially adjacent, as UV illumination has been optimized for minimal cross-talk between AOIs (Merritt et al. 2020). We used this segmentation strategy to separate tumor and the tumor microenvironment (TME) to test whether WTA can detect expected spatial differences in gene expression patterns in tissue. This experiment was also used as a model to assess the impacts of technical features, such as AOI size and sequencing depth, on WTA performance.
Two serial FFPE sections from human colorectal cancer (CRC) and non-small cell lung cancer (NSCLC) samples were labeled with fluorescent antibodies against PanCK to mark tumor, PTPRC to mark immune cells, and CD3E to mark T cells. After labeling the tissue with these morphology markers, we selected regions of interest in different pathological areas: tumor and hyperproliferative regions in CRC samples, and tumor and invasive-margin regions in NSCLC samples. Regions of interest were then segmented into tumor (PanCK+) and TME (PanCK−) AOIs (Fig. 3A).
Effect of areas of illumination (AOI) size and sequencing depth on biological conclusions from segmented tumor and tumor microenvironment. (A) Left: Representative images of the colorectal cancer (CRC) and non-small cell lung cancer (NSCLC) samples. Tumor, invasive-margin, and hyperproliferative regions are highlighted. Tissues were stained with antibodies against PanCK, CD3E, and PTPRC. Right: Enlarged region of the CRC image to highlight the size titration and segmentation strategy. Circular regions of interest were automatically segmented into tumor (orange) and immune (blue) compartments. (B) Scatterplot of AOI area versus number of cells with points colored by area bin: Very small, <2300 μm2; small, 2300–7850 μm2; mid, 7850–49,000 μm2; large, >49,000 μm2. (C) Number of genes detected per AOI for tumor and immune compartments in each AOI size bin, colored as in B. (D) Principal component analysis of variation between samples using genes detected above background in >20% of AOIs. PC1 versus PC2 is plotted with points colored by tumor type and shaped by segment type. (E) Spearman's correlation of WTA counts from each AOI with all RNA-seq data sets in TCGA. AOIs are ordered by area on the x-axis, and each point is a pairwise comparison with a data set in TCGA. Points are colored by TCGA tumor type: colon adenocarcinoma (blue), rectal adenocarcinoma (green), lung adenocarcinoma (red), lung squamous cell carcinoma (orange), and other (gray). AOIs are labeled by area bin, colored as in B. (F) Correlation of counts, single-sample Gene Set Enrichment Analysis (ssGSEA) enrichment, and cell type deconvolution between AOIs. For each metric, Spearman's correlations were calculated between each AOI compared with the largest AOI sizes, and averaged within different AOI size bins. (G) Left: Spearman's correlation of counts for each subsampled read depth and AOI size relative to counts at 300 reads/μm2. Right: Number of genes detected above background for each read depth and AOI size.
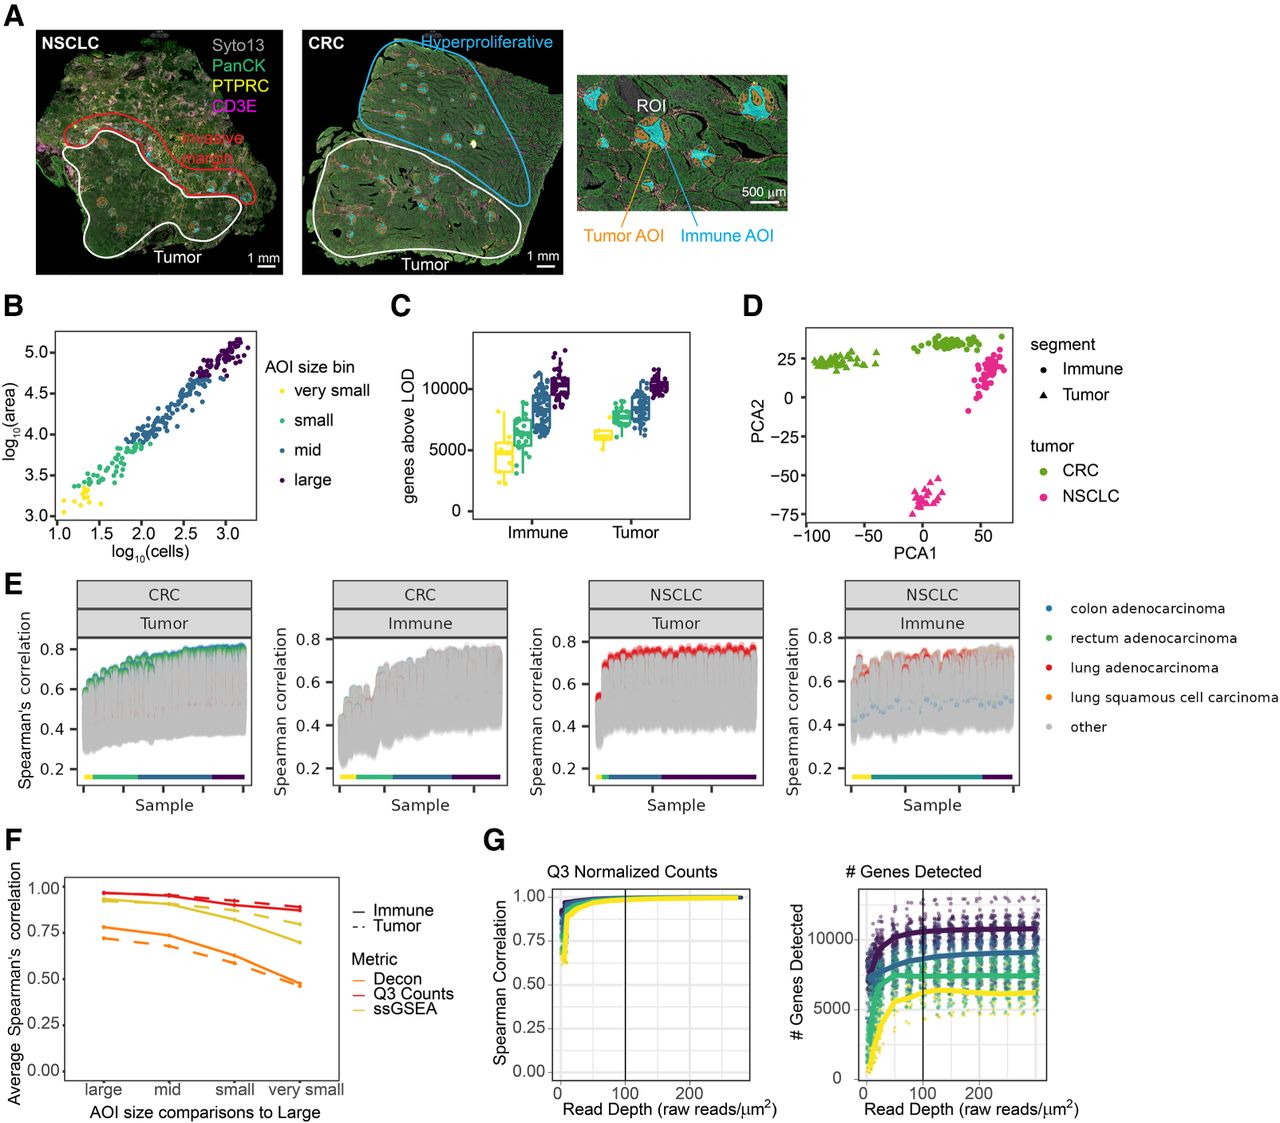
To assess the effect of AOI size on WTA performance, we selected circular regions on interest of various sizes and binned the segmented AOIs into four bins by area, a metric that is well correlated with cell count (Fig. 3B). Area bins ranged from “very small” (<2300 μm2 area, equivalent to a 55-μm-diameter circle with an average of 20 cells) to “large” (>49,000 μm2 area, equivalent to a 250-μm-diameter circle with an average of 920 cells). WTA counts were well correlated between large and smaller AOIs: large AOIs had a median Pearson's correlation of 0.94 with each other, and very small AOIs had a median correlation of 0.71 with large AOIs (Fig. 3F; Supplemental Fig. S8). An increasing number of genes were detected above background in larger AOIs in both tumor and TME, with ∼6000 genes detected per AOI in very small AOIs and ∼11,000 genes detected in large AOIs (Fig. 3C). Genes detected in small AOIs were generally a subset of genes detected in large AOIs with very few genes detected only in small AOIs (Supplemental Fig. S8). Counts of genes encoding the markers used for segmentation (CD3E, PTPRC, and keratins) were highly enriched (≥fivefold) in the expected segment type, and enrichments were similar for all AOI sizes (Supplemental Fig. S8). Samples clustered by biological annotation (tumor type and tumor vs TME) regardless of AOI size (Fig. 3D).
Next, we correlated gene expression of each segmented AOI to all bulk RNA-seq data sets in The Cancer Genome Atlas (TCGA) (The Cancer Genome Atlas Research Network et al. 2013). One hundred percent of tumor segments had the highest correlation with the expected tumor data sets in TCGA regardless of AOI size (Fig. 3E). Correlation coefficients with the best matching tumor increased with AOI size, from ∼0.6 in very small AOIs to ∼0.8 in large AOIs. As expected, TME segments generally did not correlate best with the matching tumor types in bulk TCGA RNA-seq, underscoring the value of segmentation for capturing gene expression profiles of less abundant cell types.
We further examined whether WTA could detect expected biological differences between tumor and TME in AOIs of different sizes. Pathway analysis showed that immune-related pathways, such as interleukin signaling and tumor necrosis factor signaling, were enriched in TME, whereas pathways related to cell motility, proliferation, and cancer-associated signaling were enriched in tumors (Supplemental Fig. S8). The results of pathway analysis were well correlated between AOIs of the same type and between large and small AOIs (Fig. 3F). We next performed cell type deconvolution with SpatialDecon, an algorithm for estimating the abundance of cell types defined by single-cell sequencing in spatial gene expression data (Danaher et al. 2022), using gene expression profiles of immune and stromal cells to characterize the immune cell content of tumor and TME segments. As expected, tumor segments had a very low abundance of immune cells relative to TME for all AOI sizes (Supplemental Fig. S8). Cell type deconvolution results were more variable between individual AOIs in all size bins, but correlation decreased with size to a similar degree as other metrics (Fig. 3F). These results show the robustness of WTA for biological characterization across a range of AOI sizes.
We also assessed the impact of sequencing depth on WTA data. All AOIs were deeply sequenced, and reads were subsampled in silico from a read depth of 5 raw reads/μm2 to 300 raw reads/μm2. Analysis of five replicates of the subsampling at each read depth showed that increasing read depth corresponds to a lower fraction of unique UMIs and more reads per UMI, corresponding to higher sequencing saturation of the libraries (Supplemental Fig. S9). Small AOIs reached higher saturation at lower read depths than large AOIs, consistent with lower molecular complexity in these samples. For each subsampled data set, we compared the number of genes detected, correlations of counts, pathway enrichment results, cell type deconvolution results, and differential expression results to the highest sequencing depth. For most metrics and AOI sizes, results were well correlated, at all but the lowest sequencing depths. Correlations generally stabilized by 100 raw reads/μm2, corresponding to a sequencing saturation of ∼50%. The correlation of cell type deconvolution results did continue to improve with higher read depth, especially in small AOIs, suggesting that robust deconvolution might benefit from higher sequencing saturation (Fig. 3G; Supplemental Fig. S9).
Profiling transcriptomes of anatomical structures in normal kidney and kidney disease
To show the power of WTA to integrate the transcriptome with annotated histological and pathological features, we asked how the transcriptome is altered in anatomically distinct regions of the kidney with diabetic kidney disease (DKD). The kidney nephron has a complex structure that includes the glomerulus, a cluster of specialized cells that forms the filtration barrier, and the tubule, which reabsorbs water and small molecules. The effects of DKD on the glomeruli have been extensively studied, such as a loss of glomerular filtration, inflammation, and immune cell infiltration (Reidy et al. 2014; Thomas et al. 2015). DKD also affects other parts of the kidney; therefore, we used WTA to spatially profile the transcriptomes of three nephron substructures: the glomeruli, the proximal convoluted tubules, and the distal convoluted tubules.
We profiled three normal and four DKD FFPE human kidney samples labeled with fluorescent antibodies targeting epithelia (PanCK), immune cells (PTPRC), and podocytes (WT1) in glomeruli. Glomeruli and tubules were identified morphologically and polygon-shaped AOIs were drawn to capture each structure (Fig. 4A). Tubules were segmented based on the PanCK signal into proximal (PanCK−) and distal tubules/collecting duct (PanCK+). Within each sample, individual glomeruli were annotated by a pathologist for severity of disease using the fluorescence images and hematoxylin and eosin (H&E) images of serial sections. Data were collected from both relatively healthy and abnormal glomeruli in both normal and DKD samples (Fig. 4B).
Spatial heterogeneity in gene expression changes associated with diabetic kidney disease in human kidneys. (A) Left: Representative fluorescence images of normal and diabetic human kidneys. Tissues were stained with antibodies against PanCK, WT1, and PTPRC. Right: Example images from a normal kidney highlighting the AOI strategy. Glomeruli were profiled using polygon-shaped areas of illuminations (AOIs), and tubules were automatically segmented into proximal tubules (PanCK−) and distal tubules (PanCK+). (B) Individual glomeruli in each kidney sample were annotated by degree of pathology. A representative H&E image (left) and fluorescence image (right) from the same region of a diabetic kidney disease (DKD) specimen are shown. Glomeruli with a higher degree of abnormality are circled in gray and labeled “A”, whereas more normal glomeruli are circled in white and labeled “N”. (C) Principal component analysis of variation between samples using genes detected above background in >1% of AOIs. PC1 versus PC2 is plotted, with substructure indicated by color and disease status indicated by shape. (D) Boxplots of counts in all AOIs of three example genes differentially expressed between kidney substructures with the corresponding antibody-stained images from the Human Protein Atlas (https://www.proteinatlas.org/) (Uhlén et al. 2015). (E) Left: Heatmap of differentially expressed genes between normal and DKD in glomeruli, distal tubules, and proximal tubules. All genes are significant at FDR < 0.05 and a fold change of >1.5. Genes are annotated by the structure in which they were significantly differentially expressed, or “multiple” for the genes significant in more than one structure. Columns and rows are clustered by hierarchical clustering and the data are scaled by row. Right: Boxplot of normalized counts for two example differentially expressed genes in normal and DKD kidney structures. (F) Left: Results of cell type deconvolution of glomeruli using single-cell expression data from Young et al. (2018). Data are displayed as stacked barplots with each bar as a single AOI and the estimated proportion of each cell type colored, faceted by disease status. Right: Boxplots of proportions of two example differentially abundant cell types in normal and DKD glomeruli (t-test Bonferroni-corrected P-value < 0.05). MNP, mononuclear phagocytes; DC, dendritic cells. (G) Pie charts overlaid on the fluorescence image of a single kidney, showing the proportion of different glomerulus and immune cell types for each glomerulus profiled in a representative disease sample. Each plot is outlined based on pathological annotation: abnormal glomeruli (blue), healthy glomeruli (red).
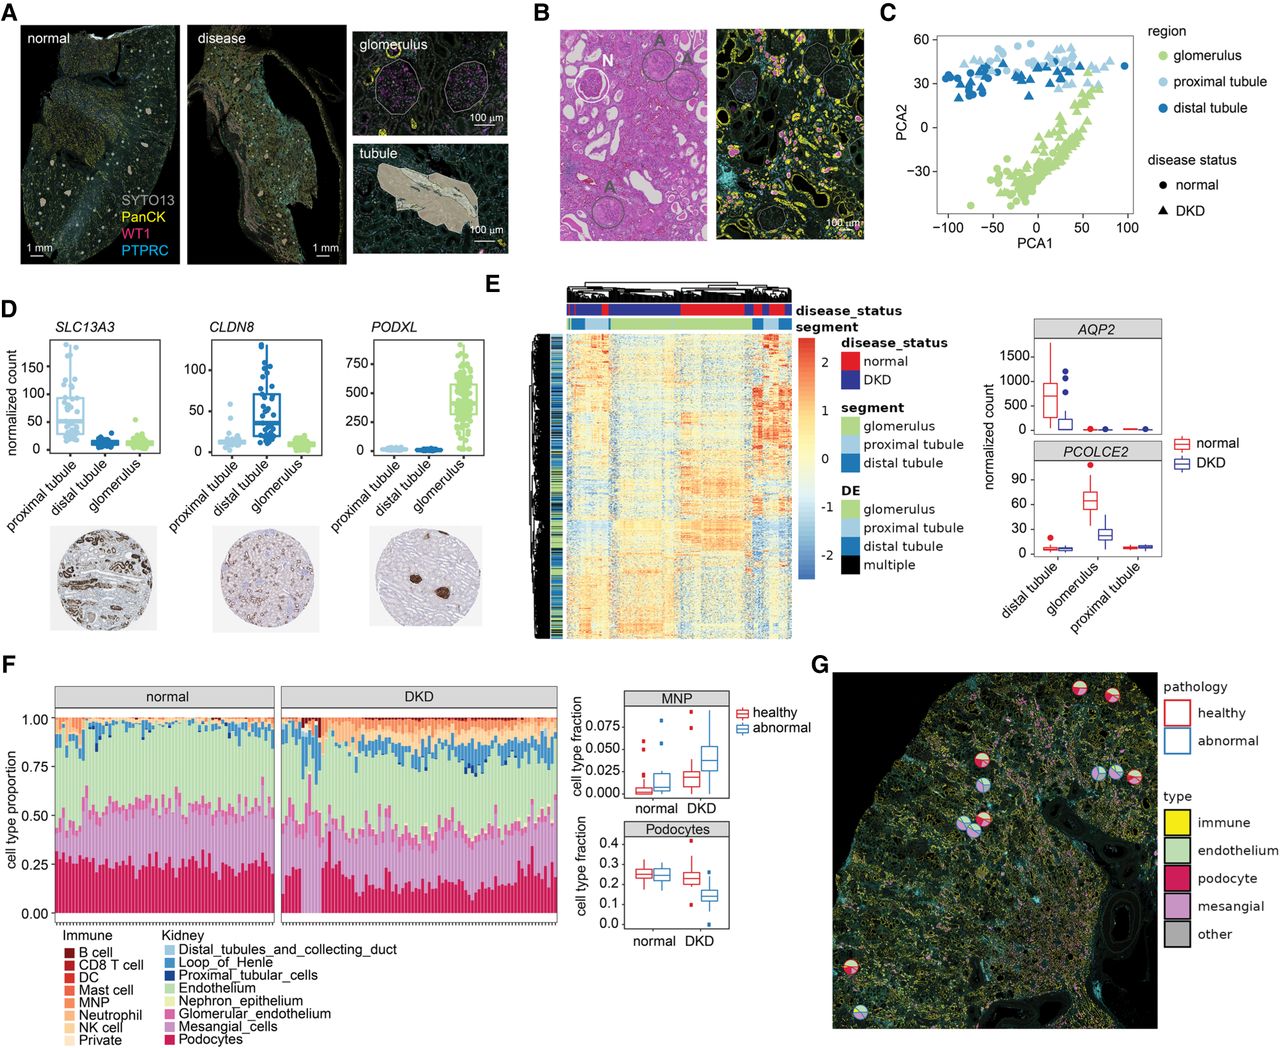
Overall, we profiled 231 AOIs that passed quality filters, across which we detected and quantified 16,084 genes. AOIs clustered by region and by disease status more closely than by patient (Fig. 4C; Supplemental Fig. S10). In normal kidneys, we identified more than 6000 significantly differentially expressed genes between glomeruli and tubules, and more than 8000 differentially expressed genes between proximal and distal tubules. There is a strong concordance between genes differentially expressed in our study and those differentially expressed in kidney single-cell RNA-seq (Supplemental Fig. S10; Young et al. 2018). Furthermore, we validated example genes differentially expressed in each structure with publicly available antibody-staining data from the Human Protein Atlas (Uhlén et al. 2015), and saw excellent concordance of spatial localization (Fig. 4D).
At the pathway level, differentially expressed pathways between glomeruli, proximal, and distal tubules recapitulated known aspects of kidney biology. For example, pathways specifically enriched in proximal tubules included anion and amino acid transporters, which are known to be highly expressed in proximal tubules, although bicarbonate transporters were enriched in both proximal and distal tubules as expected. Pathways enriched in glomeruli include nephrin and SEMA3A signaling, which are key proteins expressed in cells of the glomerular filtration membrane (Supplemental Fig. S10; Reidy and Tufro 2011; Martin and Jones 2018).
With DKD, we observed 2400 differentially expressed genes across the different kidney substructures compared with normal kidney samples. For most genes dysregulated in disease, expression changes were correlated across the different anatomical structures, but genes were altered only in specific structures (Fig. 4E). For example, the gene PCOLCE2 is specifically expressed in glomeruli and substantially down-regulated with DKD. Expression of this gene has been observed in glomerular podocytes, a specialized cell that forms the glomerular filtration barrier, and lower expression of this gene correlates with loss of renal function in patients with chronic kidney disease (Ju et al. 2013). The aquaporin gene family (AQP2, AQP3) is strongly down-regulated in the distal tubules with disease. Aquaporins are specifically expressed in tubules and are necessary for the regulation of urine concentration by the kidneys (Nielsen et al. 1999). These results indicate that DKD can cause loss of substructure-specific gene expression critical for normal kidney function.
Loss of glomerular podocytes and increased immune cell infiltration are hallmarks of DKD. We recapitulated this phenotype using cell type deconvolution with the SpatialDecon algorithm using gene expression signatures from published kidney single-cell RNA sequencing data (Young et al. 2018). There was a marked loss of podocytes in glomeruli with DKD, which was heterogeneous across individual glomeruli, and an increased abundance in most immune cell types in all substructures (Fig. 4F; Supplemental Fig. S10). In both diseased or normal samples, pathologically abnormal glomeruli had a more profound loss of podocytes and higher levels of immune infiltration compared with normal glomeruli. In particular, the increased abundance of B cells, natural killer cells, and mononuclear phagocytes in DKD kidneys was more profound in pathologically abnormal glomeruli (Fig. 4F; Supplemental Fig. S10). This spatial heterogeneity was observed within individual diseased kidneys (Fig. 4G), indicating that some glomeruli are more affected by disease despite close physical proximity. In total, these results demonstrate the feasibility of whole transcriptome profiling of specific organ substructures to detect spatially variable disease-related abnormalities.
Identifying organ substructure–specific transcriptomes in the developing mouse embryo
Another anticipated use of WTA is to catalog spatial gene expression profiles in histological structures and anatomical regions across organs. To show the use of WTA for building spatial organ atlases, we profiled whole transcriptomes of different organs and organ substructures in a developing mouse embryo. A single fixed frozen E13.5 mouse embryo was sectioned along the sagittal plane. Six sections spanning the embryo were stained with antibodies against TRP63 (epithelial marker) and TUBB3 (neuronal microtubule marker), and hybridized with mouse WTA probes (Fig. 5A).
Spatial profiling of transcriptional programs during organogenesis in a midgestation mouse embryo. (A) Left: Schematic and representative image of the fixed frozen E13.5 mouse embryo profiled. Embryos were labeled with antibodies against TRP63 (magenta) and TUBB3 (yellow). Autofluorescence is shown in green. Right: Example images of each organ profiled showing the areas of illumination (AOI) profiling strategy. Freeform polygon AOIs capture anatomical substructures of each organ. (B) Expression of marker genes for specific organs and cell types in an example section compared with in situ hybridization (ISH) images of the same genes in E14.5 mouse embryos from the GenePaint database (https://gp3.mpg.de/, Diez-Roux et al. 2011; Visel et al. 2004). Tissue, tissue substructure, or normalized scaled WTA count is plotted over the shape of each AOI. (C) Heatmap showing scaled expression of the 2000 most variable genes across the data set. Columns and rows are clustered by hierarchical clustering and columns are annotated by organ and organ substructure. (D) Heatmaps showing scaled expression of the top 50 most differentially expressed genes in epithelium (left) and mesenchyme (right). All genes shown are significant at Bonferroni-corrected P-value < 0.01. Columns and rows are clustered by hierarchical clustering and columns are annotated by organ. (E) Left: Schematic of key transcription factor expression in stomach and gut development (adapted from Willet and Mills 2016). Right: Expression of the same transcription factors plotted on example AOIs from a representative section. (F) Heatmap showing scaled expression of Cdx2 and Cdx2-target genes from Gao et al. (2009) in esophagus, stomach, duodenum, and midgut AOIs. Columns and rows are clustered by hierarchical clustering and columns are annotated by organ and organ substructure.
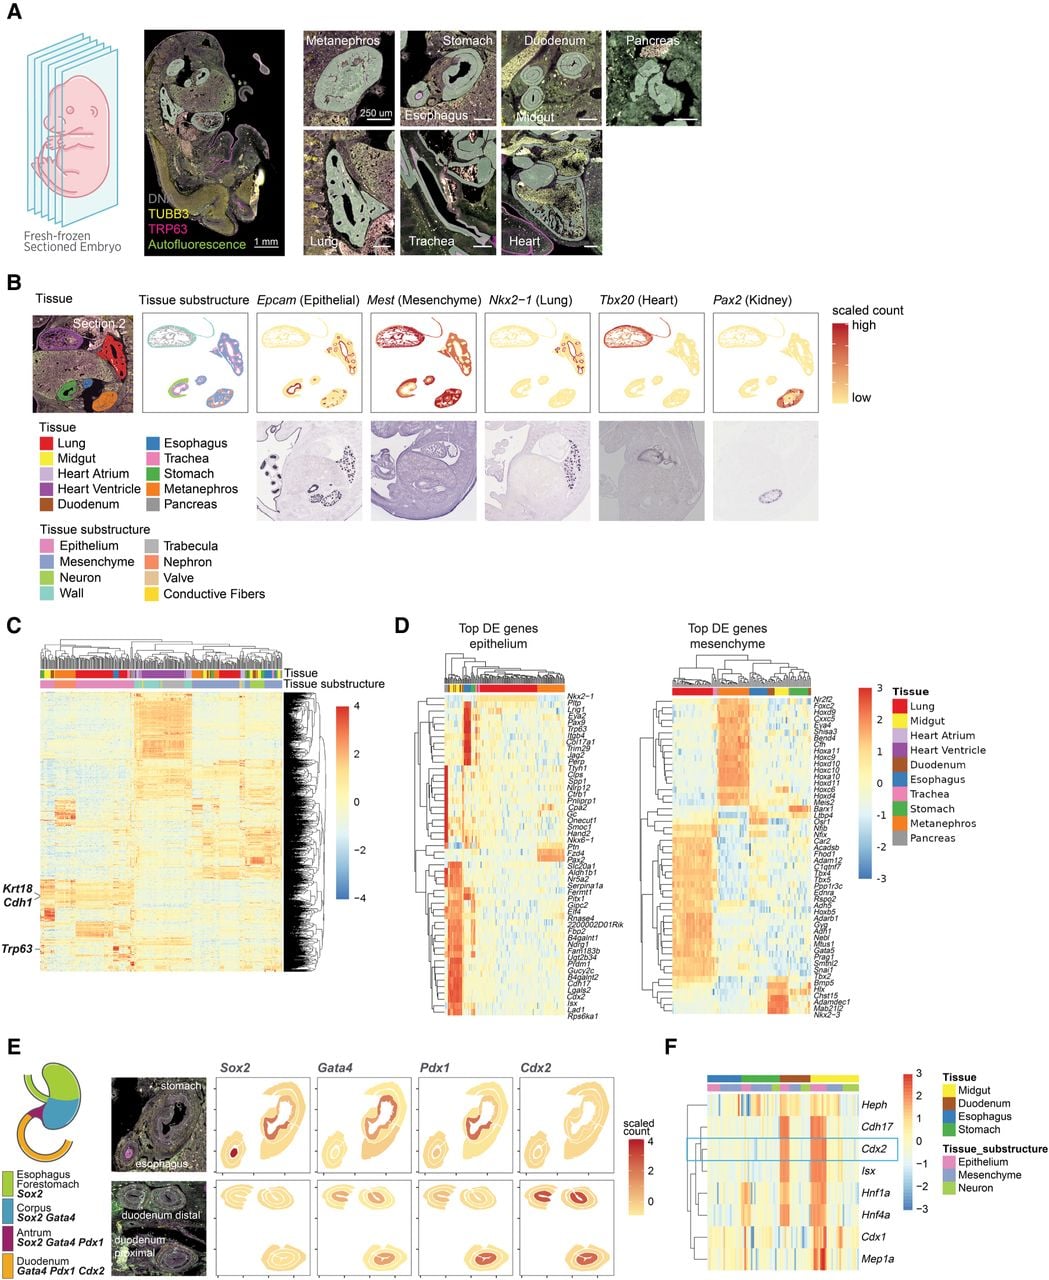
AOIs were selected in nine organs across six sections (heart, lung, metanephros, pancreas, midgut, duodenum, stomach, esophagus, and trachea). Within each organ, freeform polygon-shaped AOIs were drawn to capture anatomically distinct substructures using the fluorescence image and an H&E-stained serial section (Fig. 5B; Supplemental Fig. S11). For example, in the developing heart, we placed AOIs in the ventricle wall, atrium wall, trabeculae, conductive fibers, and valves. In the stomach, esophagus, duodenum, and midgut, we selected AOIs in the epithelial, neural, and mesenchymal layers.
We profiled the whole transcriptome of 347 AOIs across the nine organs, with 2–5 substructures per organ. We detected a total of 17,662 genes expressed above background, indicating that nearly the entire transcriptome is detectable across diverse tissues by WTA. Examining the spatial expression of cell type–specific marker genes showed the expected patterns; for example, the epithelial marker Epcam was expressed in epithelial AOIs in all tissues whereas the mesenchymal marker Mest was highly expressed in the mesenchyme and heart but not in the epithelial AOIs. We observed that genes known to be highly expressed in specific tissues were restricted to the expected tissue, with spatial variability within the tissue. For instance, the lung transcription factor Nkx2-1 was expressed in the lung and trachea epithelium as previously reported (Minoo et al. 1999), and the kidney transcription factor Pax2 was specifically expressed in AOIs in the metanephros cortex (Minoo et al. 1999; Bouchard et al. 2002). The spatial expression pattern of tissue-specific or substructure-specific genes identified by WTA matched the observed expression pattern by colorimetric RNA ISH of E14.5 mouse embryos (Fig. 5B; Visel et al. 2004; Diez-Roux et al. 2011).
Clustering AOIs by gene expression reveals that heart AOIs cluster separately from the other organs, and that for the nonheart AOIs, similar substructures cluster together first and then by organ. Epithelial AOIs form one cluster, as do mesenchymal and neural AOIs. Within each substructure, both common and tissue-specific genes were identified. Across the epithelial AOIs, highly expressed genes include epithelial markers Cdh1 and Krt18 (Fig. 5C). Among tissue-specific epithelial genes, Trp63 was expressed only in the epithelium of the esophagus and trachea (Fig. 5C), matching the expression pattern of the TRP63 antibody morphology marker used in this study.
As most of the organs profiled have an epithelial and mesenchymal region, we identified genes differentially expressed between organs in these two cell types (Fig. 5D). Organ-specific genes were nearly nonoverlapping between epithelium and mesenchyme, highlighting the value of capturing substructure-specific transcriptomes over bulk organ gene expression profiling. The top organ-specific genes include key developmental transcription factors: Nkx6-1, a critical regulator of pancreas β cell development (Aigha and Abdelalim 2020), was uniquely expressed in the pancreas epithelium; Cdx2, an intestine-specific transcription factor necessary for intestine differentiation (Gao et al. 2009), was expressed in the duodenum and midgut epithelium; and Barx1, which is necessary for stomach differentiation (Kim et al. 2005), was localized to the stomach mesenchyme.
As developmental transcription factors were among the most differentially expressed genes across organs and organ substructures, we next asked whether our data could recapitulate the developmental specification of the digestive system in mid-gestation embryos. Around E13, the transcription factors Sox2, Gata4, Pdx1, and Cdx2 are localized in an overlapping pattern from anterior to posterior in the developing esophagus, stomach, and intestine and are necessary for proper specification of those tissues (Willet and Mills 2016; Kumar et al. 2019). Our data accurately recapitulated this known pattern of transcription factor expression across tissues and revealed spatial patterns within each tissue (Fig. 5E). The four transcription factors were predominantly located to the epithelium in each tissue, and Pdx1 is more highly expressed in the liver proximal section of the duodenum than the distal section. Furthermore, we examined the expression of pro-intestinal targets of Cdx1 in digestive system AOIs (Raghoebir et al. 2012). Several canonical Cdx2 targets (e.g., Cdh17) were expressed in the same spatial pattern as Cdx1, which is limited to the intestinal epithelium. However, others were expressed more broadly or narrowly. For example, Hnf1a and Hnf4a were also expressed in stomach epithelium, and Heph was also expressed in the intestinal mesenchyme, suggesting more complex regulation governing the expression of these genes (Fig. 5F). Overall, these results show the ability of WTA to reveal the complex spatial gene expression patterns governing key cell fate decisions during embryonic development.
Discussion
The Whole Transcriptome Atlas is a high-plex in situ hybridization method for spatial transcriptome profiling using the Digital Spatial Profiling platform. Here, we describe the design, performance, and applications of the human and mouse WTAs, which comprise >18,000 multiplexed probes targeting the protein-coding genes of the human or mouse transcriptome. We show that WTA data are reproducible and concordant with orthogonal gene expression profiling methods and can quantify genes with low, medium, and high expression levels depending on the size of the profiled region. Furthermore, the applications of WTA to human disease biology and mouse developmental biology show that whole transcriptome data enable comprehensive pathway-level spatial analyses.
DSP technology allows flexible and customizable region selection that can trace the boundaries of anatomical or biological structures or groups of specific cells. As a result, a wide range of AOI sizes and types are possible, from a minimum region size of 5 µm × 5 µm to a maximum of 660 µm × 785 µm (Bergholtz et al. 2021). Smaller regions have the advantage of less heterogeneity and higher spatial resolution, with the trade-off of fewer genes detected. To define these trade-offs, we benchmarked the sensitivity of WTA in various AOI sizes in homogeneous cell pellets, which are not confounded by spatial variation such that data can be directly compared with bulk RNA-seq. We find that in AOIs with ∼100 cells, we detect ∼70% of the genes observed in bulk RNA-seq, a high sensitivity given that the RNA-seq data are based on tens to hundreds of thousands of cells as input. Using RNAscope, we show that WTA sensitivity is equivalent to <1 transcript/cell in AOIs of at least 100 cells, with ∼100 transcripts required per AOI for robust detection. In tumor tissue, this sensitivity corresponds to detecting ∼6000 genes in small AOIs with <20 cells, and >10,000 genes in large AOIs with hundreds of cells. As expected, there is a trade-off between WTA signal and AOI size: more genes detected above background, better coverage of low-expressing genes, and higher reproducibility in larger AOIs. However, we show that WTA counts from small AOIs still correlate well with orthogonal gene expression methods, and that the results of downstream analyses such as clustering, differential expression, and pathway enrichment are relatively robust to AOI size. These findings will enable researchers to devise a profiling strategy that is suited to address their specific experimental question.
One feature of WTA is the inclusion of negative probes designed against synthetic sequences from the ERCC to measure the level of background probe binding in each AOI. This method has the advantage that the level of nonspecific binding and a limit of detection can be empirically defined for every AOI, with the caveat that there may be sequence-specific effects that differentially affect individual probes in specific cell types. As a partial mitigation, we removed genes that were above LOD in only a small fraction of AOIs before performing downstream analyses such as differential expression. We anticipate that future work will develop and benchmark improved methods to model background for more accurate gene detection calls, normalization, and differential expression analyses.
Transcriptome-scale spatial data enable a wide range of pathway-level downstream analyses. With WTA, we detect expected pathways enrichment in the glomeruli and tubules of human kidneys, and also show robust detection and spatial localization of the key transcription factors and their target genes in mouse organogenesis. Furthermore, methods such as cell type deconvolution allow the integration of gene expression signatures from single-cell RNA-seq data with spatial data, enabling the localization of specific cell types in space (Danaher et al. 2022). In this work, we show heterogeneity in cell type loss in diabetic kidney disease that can be linked to the pathological annotation of the tissue. The integration of scRNA-seq and WTA spatial analysis has been shown in other contexts as well, including in pancreatic ductal adenocarcinoma to reveal that a malignant cell type identified by scRNA-seq was spatially associated with higher immune infiltrations (Hwang et al. 2022).
The development of a whole transcriptome panel for both human and mouse enables a wide range of translational, clinical, and basic biology research. For example, researchers have used WTA to identify focal changes in gene expression in kidney allograft rejection (Salem et al. 2022), determine cell types affected by SARS-CoV-2 infection in the olfactory epithelium (Khan et al. 2021), characterize functional gene expression differences across a heterogenous central nervous system tumor (Dottermusch et al. 2022), and assess structure-specific responses to treatment in prostate hyperplasia (Joseph et al. 2022). To promote these broad research applications, we have shown that WTA is compatible with a variety of tissue types and sample preservation methods (FFPE, fresh frozen, and fixed frozen). Moreover, we show successful WTA experiments in diverse normal and diseased human tissue, and in a wide range of tissues in adult and developing mice. One limitation of an ISH-based technology is that new probes must be designed to target each transcriptome of interest. However, we show that mouse WTA is compatible with commonly used mouse strains despite small differences in transcript sequence. In addition, WTA can be supplemented with custom-designed probes targeting additional transcripts of interest. For example, WTA plus 26 probes designed against SARS-CoV-2 transcripts was used to create a spatial atlas of gene expression at different levels of virus infection in COVID-19 infected lungs (Delorey et al. 2021). Similarly, custom probes can be added to WTA to quantitate additional transcript isoforms and noncoding RNAs, as WTA does not require polyadenylated transcript capture.
Spatial gene and protein expression profiling with DSP has enabled discoveries in many research fields including oncology, immunology, neuroscience, and infectious disease. WTA expands the capabilities of DSP RNA profiling from 1400 genes to the whole transcriptome level and enables high-plex spatial profiling of both human and mouse tissues. Future research will combine spatial whole transcriptome profiling with complex annotations and with sample time-points to provide high-dimensional profiles of development, disease progression, and other biological processes.
Methods
Design of the Whole Transcriptome Atlas probes
The NCBI RefSeq reference transcriptomes for human (GRCh38.p13) and mouse (GRCm38.p6, C57BL/6J) were used for design of human and mouse WTA, respectively. The genes targeted included all protein-coding genes with a few exceptions (see Supplemental Methods).
In the probe design process, all possible contiguous 35–50 nucleotide sequence windows for each mRNA target were evaluated. The pool of candidates was first filtered for intrinsic characteristics including melting temperature, GC content, secondary structure, and runs of polynucleotides. Probes satisfying these parameters were further screened for homology with the full transcriptome of the parent organism using the Basic Local Alignment Search Tool (BLAST). Preference was given to probes with absence of homology with off-target genes, probes covering known protein-coding transcripts, and maximizing the coverage of the isoform repertoire. Targeting of a transcript was judged based on ≥95% sequence identity to the probe target. Previous work has found that selecting probes that are 95%–100% identical to the intended target and filtering out probes that are ≥75%–85% in homology and that possess ≥15–17 Maximum Contiguous Bases (MCB) confer excellent specificity to the intended target (Kane 2000; Rimour et al. 2005; Militon et al. 2007). Final panel candidates were further screened for intermolecular interactions with other probes in the candidate pool including potential probe–probe hybridization as well as minimizing common sequences between probes.
For both human and mouse WTA, negative control probes were designed against synthetic sequences from the External RNA Controls Consortium (ERCC) set (The External RNA Controls Consortium 2005). Lack of similarity to any known transcripts was confirmed by BLAST comparison to each transcriptome for all selected negative sequences. Negative control probes were designed to have similar GC and Tm properties as target probes and are subject to the same intermolecular interaction screening.
Probes contain an indexing sequence separated from the RNA-targeting region by a UV-photocleavable linker (Supplemental Fig. S1). The indexing sequence contains a 12-nucleotide barcode identifying the RNA-targeting sequence, a 14-nucleotide random UMI, and primer binding sites for the amplification of tags and addition of P5 and P7 adaptors for Illumina sequencing.
For the RNA FISH comparison experiments and the CRC and NSCLC experiments, an early version of the human WTA probe pool was used that differed slightly from the final commercially available version used for all other experiments. For these experiments, probes were filtered to only those in the final pool before any analyses were performed.
Sample preparation for DSP
Sample preparation was performed as described in the NanoString GeoMx RNA-NGS slide preparation manuals on a Leica Bond RX or RXm automated stainer (Leica Biosystems) or manually. Maximum sample size for imaging on the DSP instrument is 36.2 mm long by 14.6 mm wide (Bergholtz et al. 2021).
For FFPE samples, 5 µm sections were mounted on positively charged slides, baked, deparaffinized, washed in ethanol, and washed in PBS or Leica Bond Wash Solution. Targets were retrieved in Tris-EDTA pH 9.0 in a pressure cooker (manual protocol) or Leica BOND Epitope Retrieval Solution (automated protocol) for 10 min at 85°C (cell pellets), 10 min at 100°C (tonsil), or 20 min at 100°C (human CRC, human NSCLC, human kidney, and mouse tissue arrays), and washed in PBS or Bond Wash Solution. Samples were digested with 0.1 mg/mL Proteinase K for 5 min (cell pellets) or 1 µg/mL for 15 min (tissues) at 37°C and washed with PBS. For fresh frozen human tonsil samples, 5 µm sections were mounted on positively charged slides and fixed overnight in 10% NBF. Antigen retrieval, digestion, and washes were performed as described for FFPE except that the Proteinase K digestion was at room temperature. Fixed frozen mouse cell pellets (Acepix Biosciences) were fixed in 4% PFA overnight at 4°C, embedded in OCT, and snap frozen. Fixed frozen mouse embryos (Acepix Biosciences) were fixed in 10% NBF overnight at room temperature, embedded in OCT, and snap frozen. For both cell pellets and embryos, 10 µm OCT embedded sections were washed in PBS, washed in ethanol, and antigen retrieval was performed for 15 min at 85°C (embryo) or 10 min at 85°C (cell pellets). Digestion and washes were performed as for FFPE.
All samples were incubated overnight at 37°C with human or mouse WTA following the NanoString GeoMx RNA-NGS slide preparation manual at a probe concentration of 4 nM per probe in 2× SSC with 2.5% dextran sulfate, 0.2% BSA, 100 μg/mL salmon sperm DNA, and 40% formamide. During incubation, slides were covered with HybriSlip Hybridization Covers (Grace BioLabs). After incubation, coverslips were removed by soaking in 2× SSC+0.1% Tween-20. Two 25-min stringent washes were performed in 50% formamide in 2× SSC at 37°C to remove unbound probes, and samples were washed in 2× SSC. For antibody morphology marker staining, samples were incubated in blocking buffer for 30 min at room temperature in a humidity chamber, and then incubated with 500 nm SYTO13 and the relevant fluorescently conjugated antibodies (Supplemental Table S2) for 1–2 h. Samples were washed in 2× SSC and loaded on the GeoMx DSP instrument.
In situ hybridization (ISH) with RNAscope
ISH was performed using the RNAscope LS Multiplex Fluorescent Reagent kit (ACD) using a Leica Bond RX or RXm automated stainer according to the manufacturer's instructions. Antigen retrieval was performed for 15 min at 88°C, and digestions were performed with ACD protease for 15 min at 40°C. A list of probes used is in Supplemental Table S2. Probes were visualized with TSA plus Cy3, Cy5, or Opal620.
RNAscope spot counting was performed as previously described (Merritt et al. 2020). Briefly, slides were imaged using the Nikon Eclipse TE2000-E microscope at 40× magnification. Images were captured with Nikon Elements commercial software. For imaging, z stacks at 0.5 µm steps were taken from the top to bottom focal planes of each cell pellet. Exposure time was set manually to have maximal signal for the lowest expressing cell line while remaining nonsaturated for the highest expressing cell line. Maximum z-projection images were created with Nikon Elements software across all channels. QuPath software (https://qupath.github.io/) was used to quantify the number of RNAscope spots and cells imaged per field of view using the method and scripts described in Merritt et al. (2020).
For the comparison of total RNAscope fluorescence intensity with WTA counts, the mean pixel intensity of each AOI for each relevant channel in the DSP 20× scan image was extracted and multiplied by total AOI area to get total fluorescence intensity.
DSP experiments
DSP experiments were performed according to the NanoString GeoMx-NGS DSP Instrument manual and as previously described (Merritt et al. 2020; Bergholtz et al. 2021). Briefly, slides were imaged in four fluorescence channels (FITC/525 nm, Cy3/568 nm, Texas Red/615 nm, Cy5/666 nm) to visualize morphology markers, and regions of interest were selected for collection. For the CRC/NSCLC and the kidney experiment, regions of interest were segmented based on the expression of morphology markers using the DSP auto-segmentation tool with manually tuned settings. AOIs were illuminated and released tags were collected into 96-well plates as previously described.
Sequencing and sequencing data processing
Library preparation was performed according to the NanoString GeoMx-NGS Readout Library Prep manual. Briefly, the DSP aspirate was dried and resuspended in 10 µL DEPC-treated water, and 4 µL was used in a PCR reaction. NanoString SeqCode primers were used to amplify the tags and add Illumina adaptor sequences and sample demultiplexing barcodes. PCR products were pooled either in equal volumes or in proportion relative to AOI size, depending on the experiment, and purified with two rounds of AMPure XP beads (Beckman Coulter). Libraries were sequenced on an Illumina NextSeq 550, NextSeq 2000, or NovaSeq 6000 according to the manufacturer’s instructions, with at least 27 × 27 paired end reads.
FASTQ files were processed using the NanoString GeoMx NGS Pipeline v2.0 or v2.2. Briefly, reads were trimmed to remove low quality bases and adapter sequences. Paired end reads were stitched and aligned, and the barcode and UMI sequences were extracted. Barcodes were matched to known probe barcodes with maximum one mismatch allowed. Reads matching the same barcode were deduplicated by UMI. The number of raw reads was highly linearly correlated with the number of unique UMIs at all AOI sizes, suggesting largely uniform library amplification (Supplemental Fig. S9). However, to correct for any PCR amplification bias, all analyses in this study use UMI deduplicated counts.
RNA-seq experiments
For the comparison to cell line RNA-seq, in-house RNA-seq data were generated for all of the mouse cell lines used in the comparison and five of 11 human cell lines (Daudi, H596, HEL, HUT78, and HS578T). Purified total RNA for each cell line was purchased from Acepix Biosciences. RNA-seq libraries were prepared using the TruSeq Stranded mRNA Library Prep kit (Illumina) following the manufacturer's instructions and using 100–125 ng of RNA per cell line as input. Libraries were sequenced on an Illumina NextSeq 550 with 75 × 75 paired end reads.
Sequencing reads were mapped to the human RefSeq transcriptome GRCh38.p13 or the mouse reference transcriptome GRCm38.p6 using Salmon v1.3.0 with default parameters (Patro et al. 2017). Transcript-level counts were collapsed to gene-level counts using tximport v3.13 (Soneson et al. 2015).
Comparison of in-house human cell line RNA-seq data to publicly available RNA-seq data from the Cancer Cell Line Encyclopedia (CCLE) (Ghandi et al. 2019) showed that our data were highly correlated with the CCLE data, and that WTA correlations and sensitivity were very similar using our data and the CCLE data. As there were CCLE RNA-seq data available for all human cell lines profiled by WTA, the CCLE data were used for the comparisons to human WTA shown in Figure 1 and Supplemental Figure S2.
Data analysis and visualization
Count data were processed and normalized using either the NanoString DSPDA software v2.2 or v2.3, or the GeoMxTools R package v1.0 (https://bioconductor.org/packages/release/bioc/html/GeomxTools.html) or an equivalent development version. AOIs with fewer than 5000 raw reads or a sequencing saturation <45% (mouse embryo experiment) or <50% (all other experiments) were filtered out of the analysis. For the negative probes, we performed outlier testing and removed outlier probes from the analysis before collapsing counts. All other targets have just one probe per target and therefore were not filtered for outliers or collapsed. A negative probe was called an outlier if it met one of two criteria. First, if the average count of a probe across all segments was <10% of the average count of all negative probes, the probe was removed from all segments. Second, if the probe was called an outlier by the Grubb's test with alpha = 0.01, it was removed from that segment. If the probe was an outlier by the Grubb's test in ≥20% of segments, it was removed from all segments. The geometric mean of the remaining probes was calculated to collapse the negative probes to a single count value.
For the analyses of the kidney and mouse embryo data, genes were filtered to only those above LOD in >1% of AOIs and counts were normalized by Q3 normalization after removal of genes consistently below LOD. For the CRC/NSCLC differential expression, ssGSEA, and cell type deconvolution analyses, genes were filtered to only those above LOD in >15% of AOIs and counts were normalized by Q3 normalization after removal of genes. For all other data sets and analyses, genes were not filtered and raw deduplicated counts were used.
For the CRC/NSCLC sequencing subsampling analysis, raw FASTQ files were subsampled to the desired read depths using seqtk (https://github.com/lh3/seqtk). Five replicates of the subsampling were performed at each read depth level and all subsamples were run through the sequencing data processing pipeline independently. For analyses in which sequencing read depth was compared, AOIs were not filtered for sequencing saturation. For analyses in which only one read depth is presented, the 150 reads/μm2 level was used and AOIs with <50% sequencing saturation were removed from the analysis.
All statistical analyses and data visualizations were performed in R (R Core Team 2021) or using the DSPDA software v2.3. Differential expression was performed using a linear mixed effect model with slide and DSP instrument as random effect variables, and P-values were corrected for multiple hypothesis testing. ssGSEA was performed using the GSVA R package (Hänzelmann et al. 2013). Cell type deconvolution was performed using the SpatialDecon R package (Danaher et al. 2022).
Data access
All raw and processed data generated in this study have been submitted to the NCBI Gene Expression Omnibus (GEO; https://www.ncbi.nlm.nih.gov/geo/) under accession number GSE190089. Data and code for reproducing the comparisons to RNA-seq and RNAscope data are available at GitHub (https://github.com/Nanostring-Biostats/SpatialResolution) and as Supplemental Code.
Competing interest statement
All authors are current or former employees and shareholders of NanoString Technologies.
Acknowledgments
We thank Michelle Kriner and Hiromi Sato from NanoString Technologies for reviewing and editing the manuscript.
Notes
[1] Supplementary material [Supplemental material is available for this article.]
[2] Article published online before print. Article, supplemental material, and publication date are at https://www.genome.org/cgi/doi/10.1101/gr.276206.121.
[3] Freely available online through the Genome Research Open Access option.
References
- ↵Aigha II, Abdelalim EM. 2020. NKX6.1 transcription factor: a crucial regulator of pancreatic β cell development, identity, and proliferation. Stem Cell Res Ther 11: 459. 10.1186/s13287-020-01977-0
- ↵Bergholtz H, Carter JM, Cesano A, Cheang MCU, Church SE, Divakar P, Fuhrman CA, Goel S, Gong J, Guerriero JL, 2021. Best practices for spatial profiling for breast cancer research with the GeoMx® Digital Spatial Profiler. Cancers (Basel) 13: 4456. 10.3390/cancers13174456
- ↵Bouchard M, Souabni A, Mandler M, Neubüser A, Busslinger M. 2002. Nephric lineage specification by Pax2 and Pax8. Genes Dev 16: 2958–2970. 10.1101/gad.240102
- ↵Brady L, Kriner M, Coleman I, Morrissey C, Roudier M, True LD, Gulati R, Plymate SR, Zhou Z, Birditt B, 2021. Inter- and intra-tumor heterogeneity of metastatic prostate cancer determined by digital spatial gene expression profiling. Nat Commun 12: 1426. 10.1038/s41467-021-21615-4
- ↵Breschi A, Gingeras TR, Guigó R. 2017. Comparative transcriptomics in human and mouse. Nat Rev Genet 18: 425–440. 10.1038/nrg.2017.19
- ↵Butler D, Mozsary C, Meydan C, Foox J, Rosiene J, Shaiber A, Danko D, Afshinnekoo E, MacKay M, Sedlazeck FJ, 2021. Shotgun transcriptome, spatial omics, and isothermal profiling of SARS-CoV-2 infection reveals unique host responses, viral diversification, and drug interactions. Nat Commun 12: 1660. 10.1038/s41467-021-21361-7
- ↵The Cancer Genome Atlas Research Network, Weinstein JN, Collisson EA, Mills GB, Shaw KRM, Ozenberger BA, Ellrott K, Sander C, Stuart JM, Chang K, 2013. The Cancer Genome Atlas Pan-Cancer analysis project. Nat Genet 45: 1113–1120. 10.1038/ng.2764
- ↵Chen KH, Boettiger AN, Moffitt JR, Wang S, Zhuang X. 2015. Spatially resolved, highly multiplexed RNA profiling in single cells. Science 348: aaa6090. 10.1126/science.aaa6090
- ↵Danaher P, Kim Y, Nelson B, Griswold M, Yang Z, Piazza E, Beechem JM. 2022. Advances in mixed cell deconvolution enable quantification of cell types in spatial transcriptomic data. Nat Commun 13: 385. 10.1038/s41467-022-28020-5
- ↵Delorey TM, Ziegler CGK, Heimberg G, Normand R, Yang Y, Segerstolpe Å, Abbondanza D, Fleming SJ, Subramanian A, Montoro DT, 2021. COVID-19 tissue atlases reveal SARS-CoV-2 pathology and cellular targets. Nature 595: 107–113. 10.1038/s41586-021-03570-8
- ↵Desai N, Neyaz A, Szabolcs A, Shih AR, Chen JH, Thapar V, Nieman LT, Solovyov A, Mehta A, Lieb DJ, 2020. Temporal and spatial heterogeneity of host response to SARS-CoV-2 pulmonary infection. Nat Commun 11: 6319. 10.1038/s41467-020-20139-7
- ↵Diez-Roux G, Banfi S, Sultan M, Geffers L, Anand S, Rozado D, Magen A, Canidio E, Pagani M, Peluso I, 2011. A high-resolution anatomical atlas of the transcriptome in the mouse embryo. PLoS Biol 9: e1000582. 10.1371/journal.pbio.1000582
- ↵Dottermusch M, Schumann Y, Kordes U, Hasselblatt M, Neumann JE. 2022. Spatial molecular profiling of a central nervous system low-grade diffusely infiltrative tumour with INI1 deficiency featuring a high-grade atypical teratoid/rhabdoid tumour component. Neuropathol Appl Neurobiol 48: e12777. 10.1111/nan.12777
- ↵Emmert-Buck MR, Bonner RF, Smith PD, Chuaqui RF, Zhuang Z, Goldstein SR, Weiss RA, Liotta LA. 1996. Laser capture microdissection. Science 274: 998–1001. 10.1126/science.274.5289.998
- ↵Eng CHL, Lawson M, Zhu Q, Dries R, Koulena N, Takei Y, Yun J, Cronin C, Karp C, Yuan GC, 2019. Transcriptome-scale super-resolved imaging in tissues by RNA seqFISH+. Nature 568: 235–239. 10.1038/s41586-019-1049-y
- ↵Espina V, Wulfkuhle JD, Calvert VS, VanMeter A, Zhou W, Coukos G, Geho DH, Petricoin EF, Liotta LA. 2006. Laser-capture microdissection. Nat Protoc 1: 586–603. 10.1038/nprot.2006.85
- ↵The External RNA Controls Consortium. 2005. The External RNA Controls Consortium: a progress report. Nat Methods 2: 731–734. 10.1038/nmeth1005-731
- ↵Gao N, White P, Kaestner KH. 2009. Establishment of intestinal identity and epithelial-mesenchymal signaling by Cdx2. Dev Cell 16: 588–599. 10.1016/j.devcel.2009.02.010
- ↵Ghandi M, Huang FW, Jané-Valbuena J, Kryukov G V, Lo CC, McDonald ER, Barretina J, Gelfand ET, Bielski CM, Li H, 2019. Next-generation characterization of the cancer cell line encyclopedia. Nature 569: 503–508. 10.1038/s41586-019-1186-3
- ↵Hänzelmann S, Castelo R, Guinney J. 2013. GSVA: gene set variation analysis for microarray and RNA-Seq data. BMC Bioinformatics 14: 7. 10.1186/1471-2105-14-7
- ↵Hwang WL, Jagadeesh KA, Guo JA, Hoffman HI, Yadollahpour P, Reeves JW, Mohan R, Drokhlyansky E, Van Wittenberghe N, Ashenberg O, 2022. Single-nucleus and spatial transcriptome profiling of pancreatic cancer identifies multicellular dynamics associated with neoadjuvant treatment. Nat Genet 54: 1178–1191. 10.1038/s41588-022-01134-8
- ↵Jerby-Arnon L, Neftel C, Shore ME, Weisman HR, Mathewson ND, McBride MJ, Haas B, Izar B, Volorio A, Boulay G, 2021. Opposing immune and genetic mechanisms shape oncogenic programs in synovial sarcoma. Nat Med 27: 289–300. 10.1038/s41591-020-01212-6
- ↵Joseph DB, Henry GH, Malewska A, Reese JC, Mauck RJ, Gahan JC, Hutchinson RC, Mohler JL, Roehrborn CG, Strand DW. 2022. 5-Alpha reductase inhibitors induce a prostate luminal to club cell transition in human benign prostatic hyperplasia. J Pathol 256: 427–441. 10.1002/path.5857
- ↵Ju W, Greene CS, Eichinger F, Nair V, Hodgin JB, Bitzer M, Lee YS, Zhu Q, Kehata M, Li M, 2013. Defining cell-type specificity at the transcriptional level in human disease. Genome Res 23: 1862–1873. 10.1101/gr.155697.113
- ↵Kane MD. 2000. Assessment of the sensitivity and specificity of oligonucleotide (50mer) microarrays. Nucleic Acids Res 28: 4552–4557. 10.1093/nar/28.22.4552
- ↵Khan M, Yoo SJ, Clijsters M, Backaert W, Vanstapel A, Speleman K, Lietaer C, Choi S, Hether TD, Marcelis L, 2021. Visualizing in deceased COVID-19 patients how SARS-CoV-2 attacks the respiratory and olfactory mucosae but spares the olfactory bulb. Cell 184: 5932–5949.e15. 10.1016/j.cell.2021.10.027
- ↵Kim BM, Buchner G, Miletich I, Sharpe PT, Shivdasani RA. 2005. The stomach mesenchymal transcription factor Barx1 specifies gastric epithelial identity through inhibition of transient Wnt signaling. Dev Cell 8: 611–622. 10.1016/j.devcel.2005.01.015
- ↵Kumar N, Tsai YH, Chen L, Zhou A, Banerjee KK, Saxena M, Huang S, Toke NH, Xing J, Shivdasani RA, 2019. The lineage-specific transcription factor CDX2 navigates dynamic chromatin to control distinct stages of intestine development. Development 146: dev172189. 10.1242/dev.172189
- ↵Lee JH, Daugharthy ER, Scheiman J, Kalhor R, Ferrante TC, Terry R, Turczyk BM, Yang JL, Lee HS, Aach J, 2015. Fluorescent in situ sequencing (FISSEQ) of RNA for gene expression profiling in intact cells and tissues. Nat Protoc 10: 442–458. 10.1038/nprot.2014.191
- ↵Martin CE, Jones N. 2018. Nephrin signaling in the podocyte: an updated view of signal regulation at the slit diaphragm and beyond. Front Endocrinol (Lausanne) 9: 302. 10.3389/fendo.2018.00302
- ↵Merritt CR, Ong GT, Church SE, Barker K, Danaher P, Geiss G, Hoang M, Jung J, Liang Y, McKay-Fleisch J, 2020. Multiplex digital spatial profiling of proteins and RNA in fixed tissue. Nat Biotechnol 38: 586–599. 10.1038/s41587-020-0472-9
- ↵Militon C, Rimour S, Missaoui M, Biderre C, Barra V, Hill D, Moné A, Gagne G, Meier H, Peyretaillade E, 2007. PhylArray: phylogenetic probe design algorithm for microarray. Bioinformatics 23: 2550–2557. 10.1093/bioinformatics/btm392
- ↵Minoo P, Su G, Drum H, Bringas P, Kimura S. 1999. Defects in tracheoesophageal and lung morphogenesis in Nkx2.1(–/–) mouse embryos. Dev Biol 209: 60–71. 10.1006/dbio.1999.9234
- ↵Nielsen S, Kwon T-H, Christensen BM, Promeneur D, Frøkiaer J, Marples D. 1999. Physiology and pathophysiology of renal aquaporins. J Am Soc Nephrol 10: 647–663. 10.1681/ASN.V103647
- ↵Patro R, Duggal G, Love MI, Irizarry RA, Kingsford C. 2017. Salmon provides fast and bias-aware quantification of transcript expression. Nat Methods 14: 417–419. 10.1038/nmeth.4197
- ↵Pelka K, Hofree M, Chen JH, Sarkizova S, Pirl JD, Jorgji V, Bejnood A, Dionne D, Ge WH, Xu KH, 2021. Spatially organized multicellular immune hubs in human colorectal cancer. Cell 184: 4734–4752.e20. 10.1016/j.cell.2021.08.003
- ↵Raghoebir L, Bakker ERM, Mills JC, Swagemakers S, van Kempen MB, Munck ABD, Driegen S, Meijer D, Grosveld F, Tibboel D, 2012. SOX2 redirects the developmental fate of the intestinal epithelium toward a premature gastric phenotype. J Mol Cell Biol 4: 377–385. 10.1093/jmcb/mjs030
- ↵Rao A, Barkley D, França GS, Yanai I. 2021. Exploring tissue architecture using spatial transcriptomics. Nature 596: 211–220. 10.1038/s41586-021-03634-9
- ↵R Core Team. 2021. R: a language and environment for statistical computing. R Foundation for Statistical Computing, Vienna. https://www.R-project.org/.
- ↵Reidy K, Tufro A. 2011. Semaphorins in kidney development and disease: modulators of ureteric bud branching, vascular morphogenesis, and podocyte-endothelial crosstalk. Pediatr Nephrol 26: 1407–1412. 10.1007/s00467-011-1769-1
- ↵Reidy K, Kang HM, Hostetter T, Susztak K. 2014. Molecular mechanisms of diabetic kidney disease. J Clin Invest 124: 2333–2340. 10.1172/JCI72271
- ↵Rendeiro AF, Ravichandran H, Bram Y, Chandar V, Kim J, Meydan C, Park J, Foox J, Hether T, Warren S, 2021. The spatial landscape of lung pathology during COVID-19 progression. Nature 593: 564–569. 10.1038/s41586-021-03475-6
- ↵Rimour S, Hill D, Militon C, Peyret P. 2005. GoArrays: highly dynamic and efficient microarray probe design. Bioinformatics 21: 1094–1103. 10.1093/bioinformatics/bti112
- ↵Salem F, Perin L, Sedrakyan S, Angeletti A, Ghiggeri GM, Coccia MC, Ross M, Fribourg M, Cravedi P. 2022. The spatially resolved transcriptional profile of acute T cell–mediated rejection in a kidney allograft. Kidney Int 101: 131–136. 10.1016/j.kint.2021.09.004
- ↵Soneson C, Love MI, Robinson MD. 2015. Differential analyses for RNA-seq: transcript-level estimates improve gene-level inferences. F1000Res 4: 1521. 10.12688/f1000research.7563.1
- ↵Ståhl PL, Salmén F, Vickovic S, Lundmark A, Navarro JF, Magnusson J, Giacomello S, Asp M, Westholm JO, Huss M, 2016. Visualization and analysis of gene expression in tissue sections by spatial transcriptomics. Science 353: 78–82. 10.1126/science.aaf2403
- ↵Stickels RR, Murray E, Kumar P, Li J, Marshall JL, di Bella DJ, Arlotta P, Macosko EZ, Chen F. 2021. Highly sensitive spatial transcriptomics at near-cellular resolution with Slide-seqV2. Nat Biotechnol 39: 313–319. 10.1038/s41587-020-0739-1
- ↵Thomas MC, Brownlee M, Susztak K, Sharma K, Jandeleit-Dahm KAM, Zoungas S, Rossing P, Groop PH, Cooper ME. 2015. Diabetic kidney disease. Nat Rev Dis Primers 1: 15018. 10.1038/nrdp.2015.18
- ↵Uhlén M, Fagerberg L, Hallström BM, Lindskog C, Oksvold P, Mardinoglu A, Sivertsson Å, Kampf C, Sjöstedt E, Asplund A, 2015. Tissue-based map of the human proteome. Science 347: 1260419. 10.1126/science.1260419
- ↵Vickovic S, Eraslan G, Salmén F, Klughammer J, Stenbeck L, Schapiro D, Äijö T, Bonneau R, Bergenstråhle L, Navarro JF, 2019. High-definition spatial transcriptomics for in situ tissue profiling. Nat Methods 16: 987–990. 10.1038/s41592-019-0548-y
- ↵Visel A, Thaller C, Eichele G. 2004. GenePaint.org: an atlas of gene expression patterns in the mouse embryo. Nucleic Acids Res 32: D552–D556. 10.1093/nar/gkh029
- ↵Wang F, Flanagan J, Su N, Wang LC, Bui S, Nielson A, Wu X, Vo HT, Ma XJ, Luo Y. 2012. RNAscope: a novel in situ RNA analysis platform for formalin-fixed, paraffin-embedded tissues. J Mol Diagn 14: 22–29. 10.1016/j.jmoldx.2011.08.002
- ↵Willet SG, Mills JC. 2016. Stomach organ and cell lineage differentiation: from embryogenesis to adult homeostasis. Cell Mol Gastroenterol Hepatol 2: 546–559. 10.1016/j.jcmgh.2016.05.006
- ↵Xia C, Fan J, Emanuel G, Hao J, Zhuang X. 2019. Spatial transcriptome profiling by MERFISH reveals subcellular RNA compartmentalization and cell cycle-dependent gene expression. Proc Natl Acad Sci 116: 19490–19499. 10.1073/pnas.1912459116
- ↵Young MD, Mitchell TJ, Vieira Braga FA, Tran MGB, Stewart BJ, Ferdinand JR, Collord G, Botting RA, Popescu DM, Loudon KW, 2018. Single-cell transcriptomes from human kidneys reveal the cellular identity of renal tumors. Science 361: 594–599. 10.1126/science.aat1699