
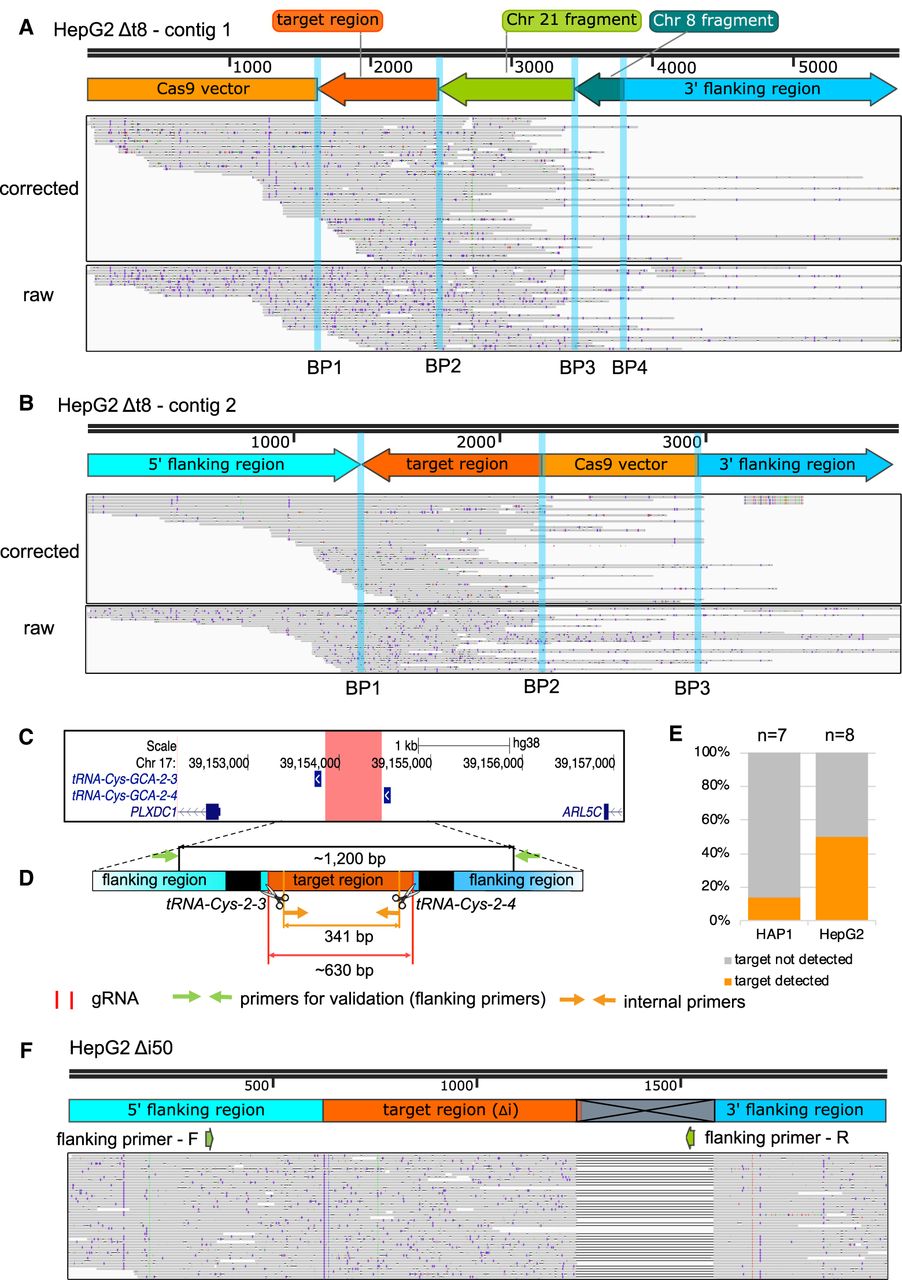
Clustered interchromosomal rearrangements, inversion of target-derived fragments, and vector integration as well as a large deletion were identified in the deletion clones HepG2 Δt8 and Δi50. (A,B) The genome browser view displays the Xdrop-LRS corrected (top) and raw (bottom) reads aligned to the de novo assembled contig 1 (A) and contig 2 (B) supporting different breakpoints (BP, blue vertical lines) within the contig. Arrows (top) show genomic orientation and approximate size of the flanking (blue) and target (dark orange) regions as well as fragments deriving from Chr 21 (light green), Chr 8 (dark green), and CRISPR-Cas9 vector (light orange) present within the contig. (C) The hg38 genome browser view shows the genomic location of the target locus (red) for the intergenic region deletion (Δi). Arrows denote the directionality of gene transcription. (D) Illustration of the design strategy for generating Δi clones. The cut sites of Cas9 (red horizontal lines and scissors), primers for validating the deletion (flanking primers, green arrows) and for detecting clones with genomic alterations (internal primers, light orange arrows) are indicated. The target region (orange) between two target tRNA genes (black) is around 630 bp in size. The size of the PCR product with flanking or internal primers in control clones is around 1200 bp or 341 bp, respectively. (E) The stacked bar plot indicates the frequency of on-target genomic alterations in the validated HAP1 (n = 7) and HepG2 (n = 8) Δi deletion clones. (F) The genome browser view displays the alignment of the Xdrop-LRS raw reads to the human reference genome (hg38) at the target locus. The large deletion is indicated in the gray crossed box. The annealing sites of the flanking primers for the validation PCR experiment are displayed with green arrows.


