
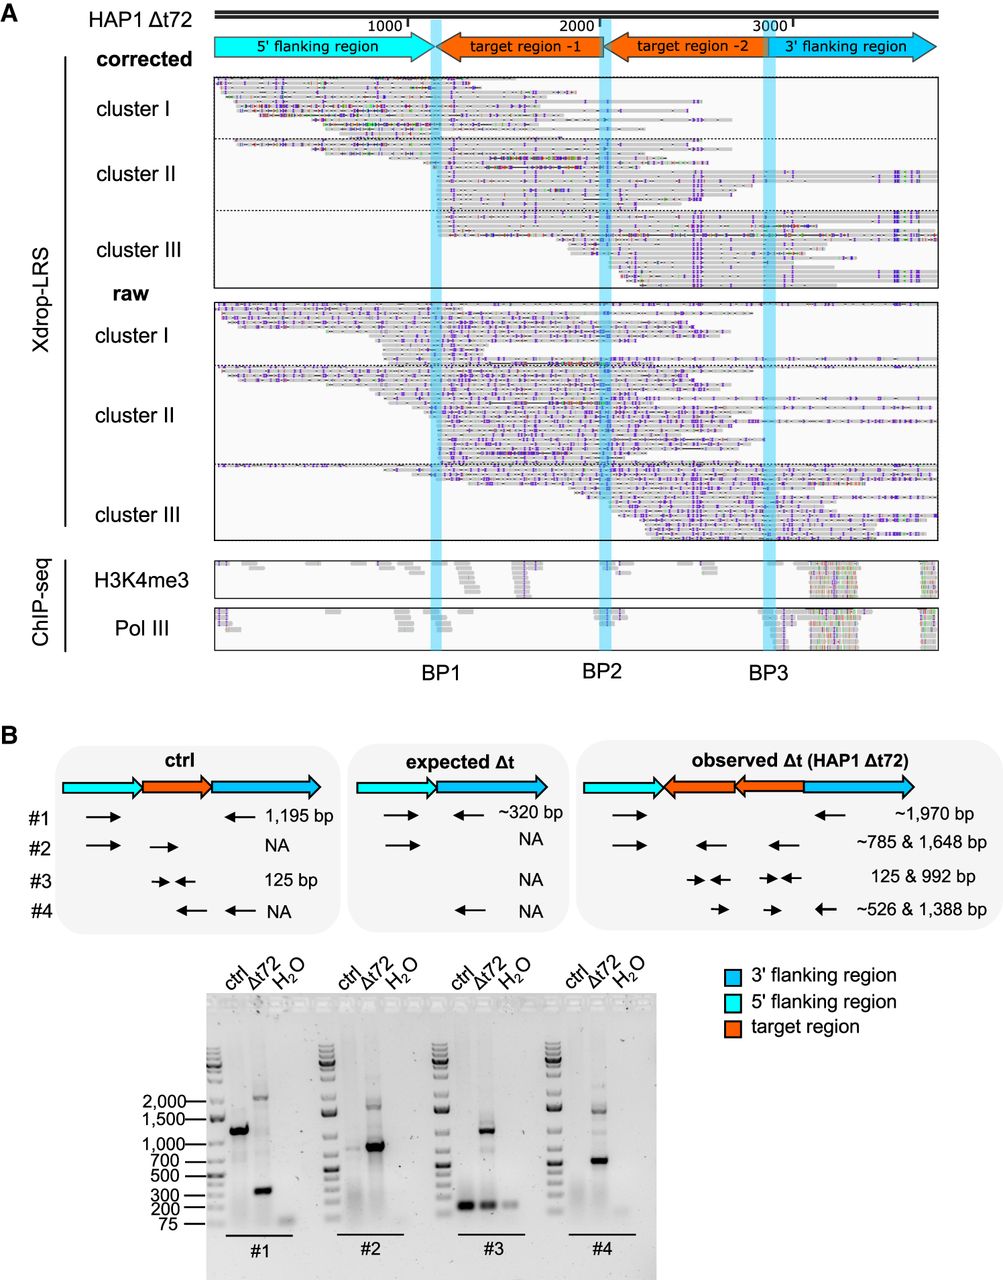
A duplication, inversion, and local insertion of target-derived fragments occurred in the deletion clone HAP1 Δt72. (A) The genome browser view shows Xdrop-LRS (top, corrected and raw reads) and ChIP-seq (bottom, histone H3 lysine 4 trimethylation [H3K4me3] and RNA polymerase III [Pol III] reads) aligned against the assembled contig. Arrows (top) show genomic orientation and approximate size of the flanking (5′ light and 3′ dark blue) and target (orange) regions within the contig. Representative aligned reads for cluster I, II, and III support three different breakpoints (BP1-3, blue vertical lines) within the contig. (B) Schematic illustration of the primer design strategy to validate contigs by PCR. The expected amplicon length (top) represents allelic composition in an unmodified control (ctrl), as well as the expected and observed deletion event in the HAP1 Δt72 clone. Agarose gel (bottom) confirms the size of the expected (∼320 bp) and observed PCR products (∼1970 bp). Marker bands specify DNA size in bp.


