
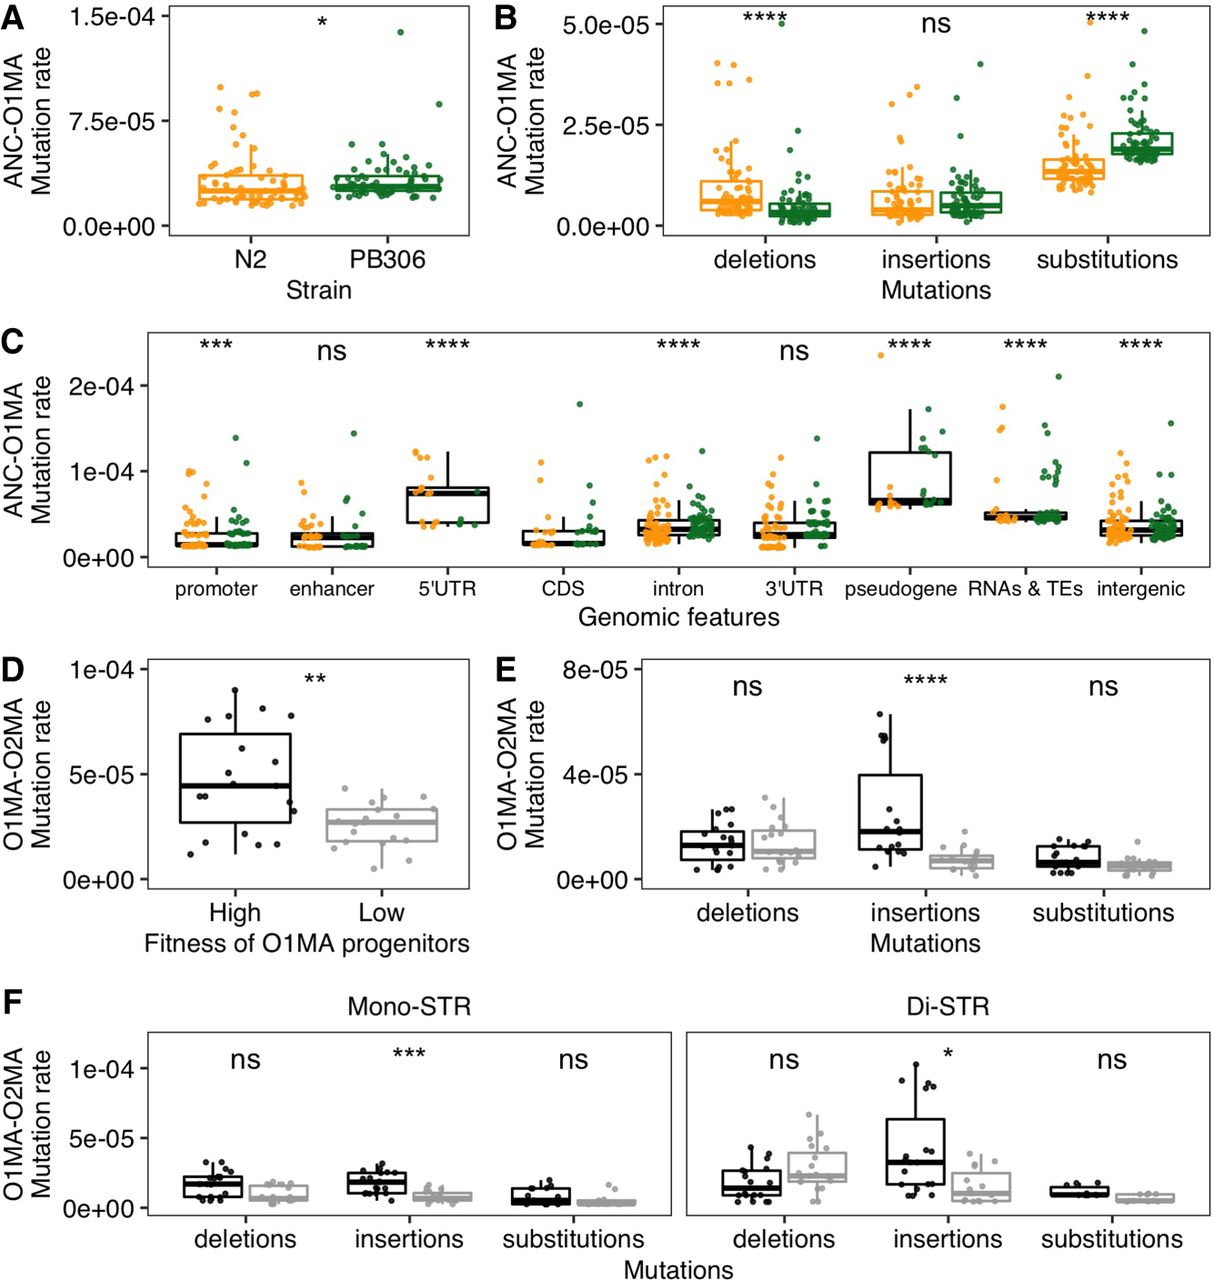
Mutation rates in mutation accumulation (MA) lines. (A,B) Comparison of total short tandem repeat (STR) mutation rates (A) and STR mutation rates of deletions, insertions, and substitutions (B) between O1MA lines derived from N2 (orange) and PB306 (green). (C) Comparison of STR mutation rates in coding sequence (CDS) regions and other regions using both N2 (orange) and PB306 (green) O1MA lines. (D–F) Comparisons of total STR mutation rates (D) and STR mutation rates of deletions, insertions, and substitutions using all pSTRs (E), or mono-STRs and di-STRs (F) between O2MA lines that were derived from N2 O1MA progenitors with high (black) and low (gray) fitness. Each dot represents the mutation rate between the ancestor strain (ANC) and one of O1MA lines (ANC-O1MA) or between one of the eight N2 O1MA lines and one of its derived O2MA lines (38 in total) (O1MA-O2MA). Statistical significance of difference comparisons (Supplemental Table S2) was calculated using the two-sided Wilcoxon test and P-values were adjusted for multiple comparisons (Bonferroni method). Significance of each comparison is shown above each comparison pair (ns: adjusted P > 0.05, [*] adjusted P ≤ 0.05, [**] adjusted P ≤ 0.01, [***] adjusted P ≤ 0.001, [****] adjusted P ≤ 0.0001).


