
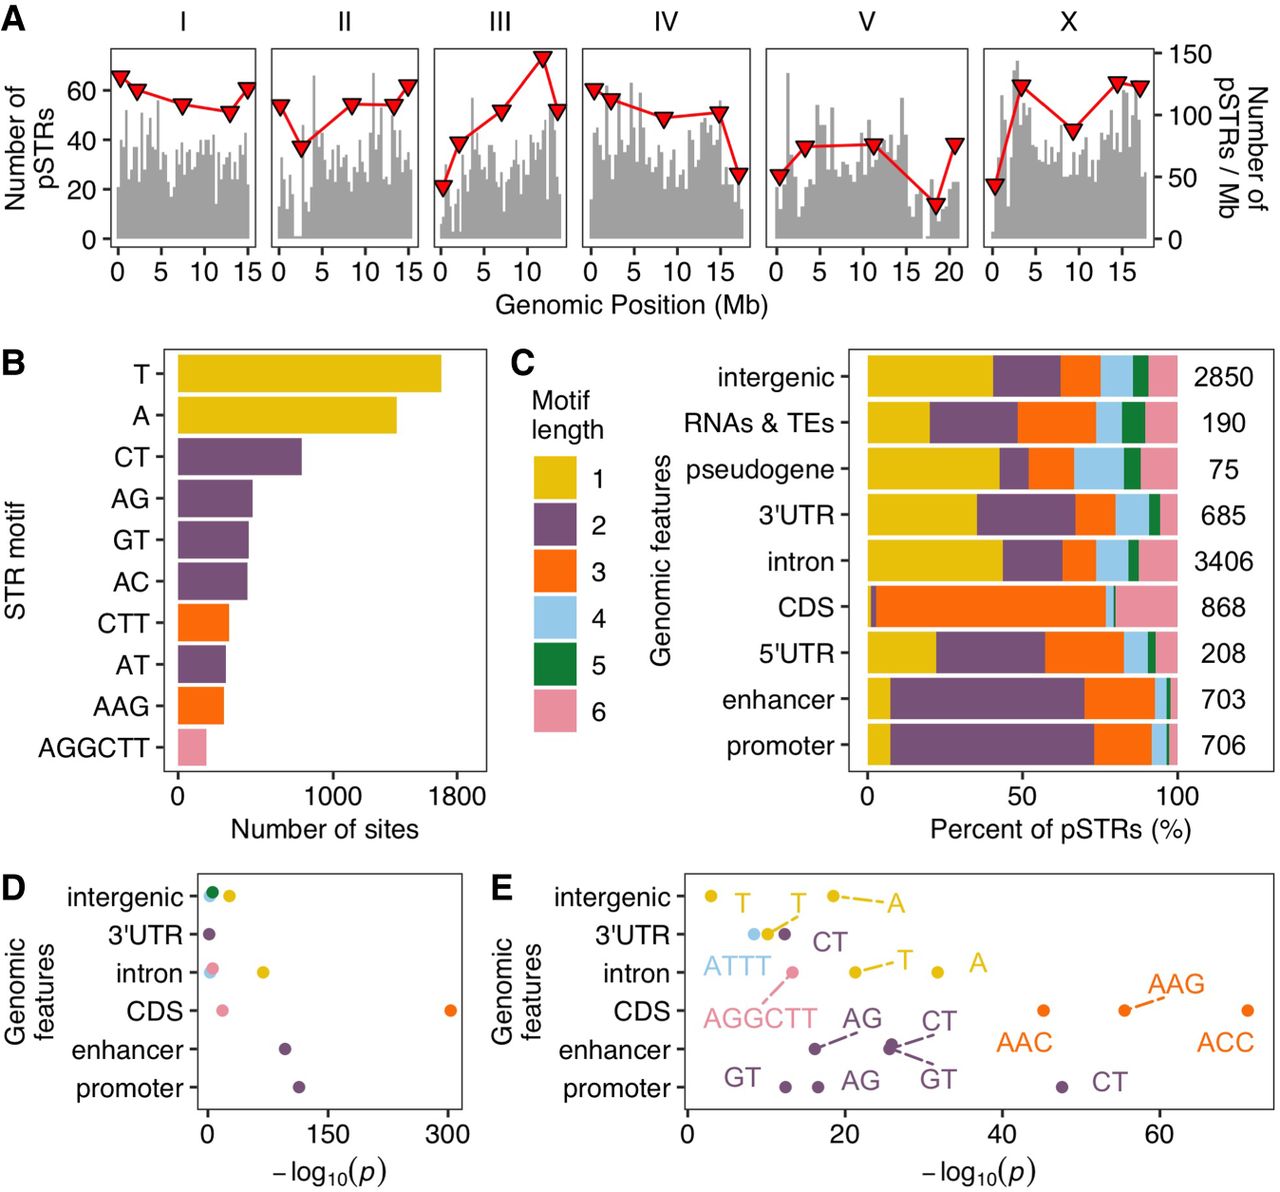
The distribution of polymorphic short tandem repeats (STRs) across the Caenorhabditis elegans genome. (A) The distribution of polymorphic STRs (y-axis on the left) in the C. elegans genome. Red triangles represent the number of STRs per Mb (y-axis on the right) in different genomic domains (tips, arms, and centers) (Rockman and Kruglyak 2009). (B) The top ten most frequent motif sequences in polymorphic STRs are shown on the y-axis, and the number of those sites on the x-axis. (C) Percent of polymorphic STRs with different motif lengths in each genomic feature are shown on the x-axis, and different genomic features on the y-axis. The total number of polymorphic STRs in each genomic feature is indicated. (D) Enriched STRs with different motif lengths (colored as in C) in different genomic features are shown. (E) The top three most enriched STR motif sequences (labeled) in each genomic feature (if enriched motifs were found) are shown. Statistical significance for enrichment tests (Supplemental Table S2) was calculated using one-sided Fisher's exact test and was corrected for multiple comparisons (Bonferroni method).


