
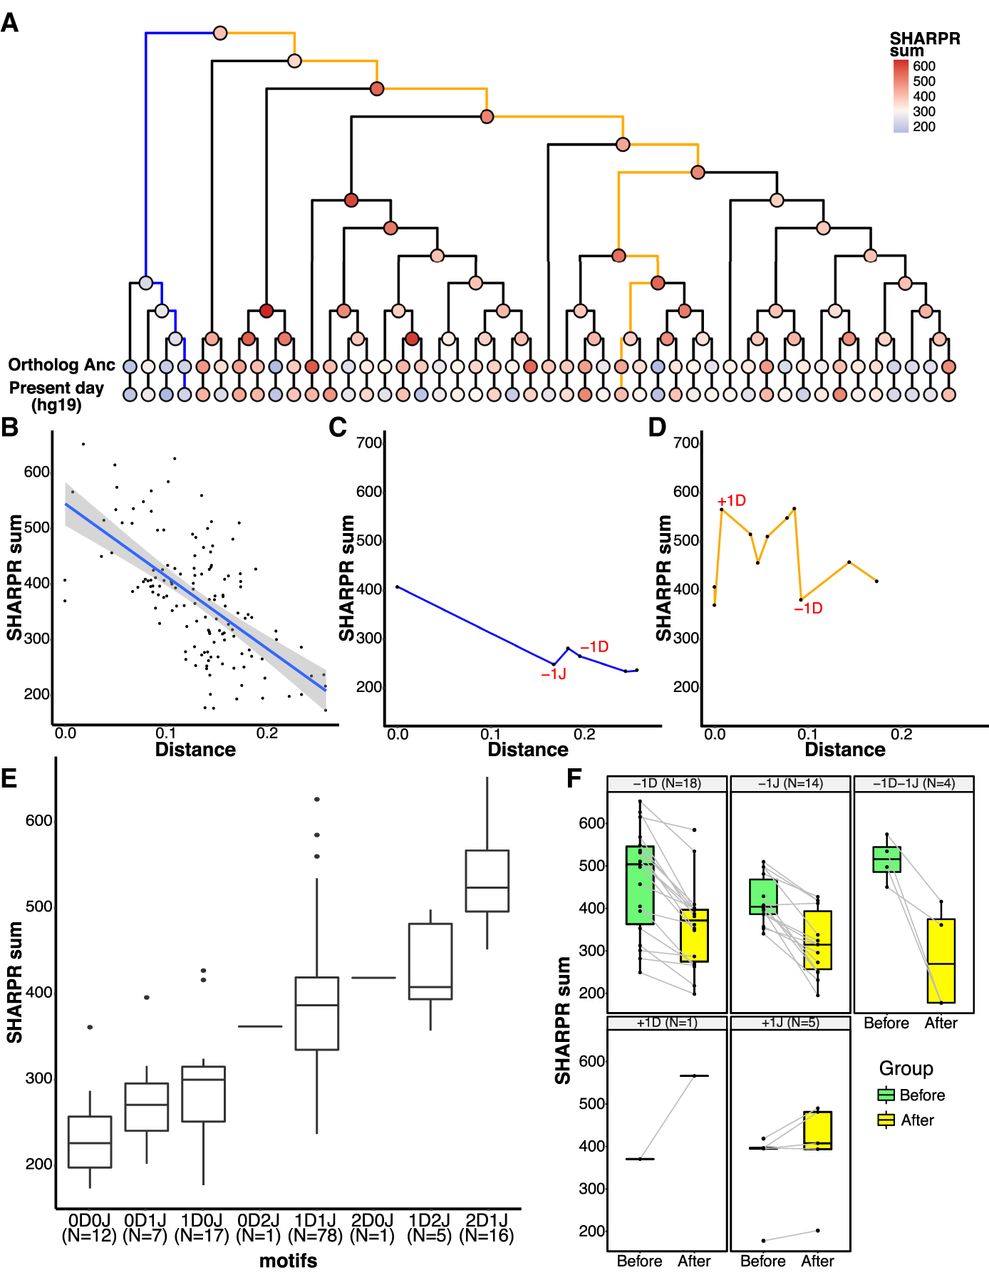
Evolution of regulatory activity in LTR18A in HepG2. (A) Phylogenetic tree of reconstructed ancestral LTR18A annotated at each node/element with the sum of SHARPR nucleotide activity scores. (B) Correlation of SHARPR sum and distance (substitution rate) from subfamily ancestor for each LTR18A in the phylogenetic tree. (C) Example of regulatory activity evolution along the blue path in A. Motif changes are labeled in red (D = DBP, J = JUN). (D) Same as C, but for the orange path in A. (E) Distribution of SHARPR sums for phylogenetic tree elements separated by DBP and JUN motif content. (F) Motif-associated changes in SHARPR sum. Each motif change in the phylogenetic tree is shown with the before and after motif change SHARPR sums connected by a line.


