
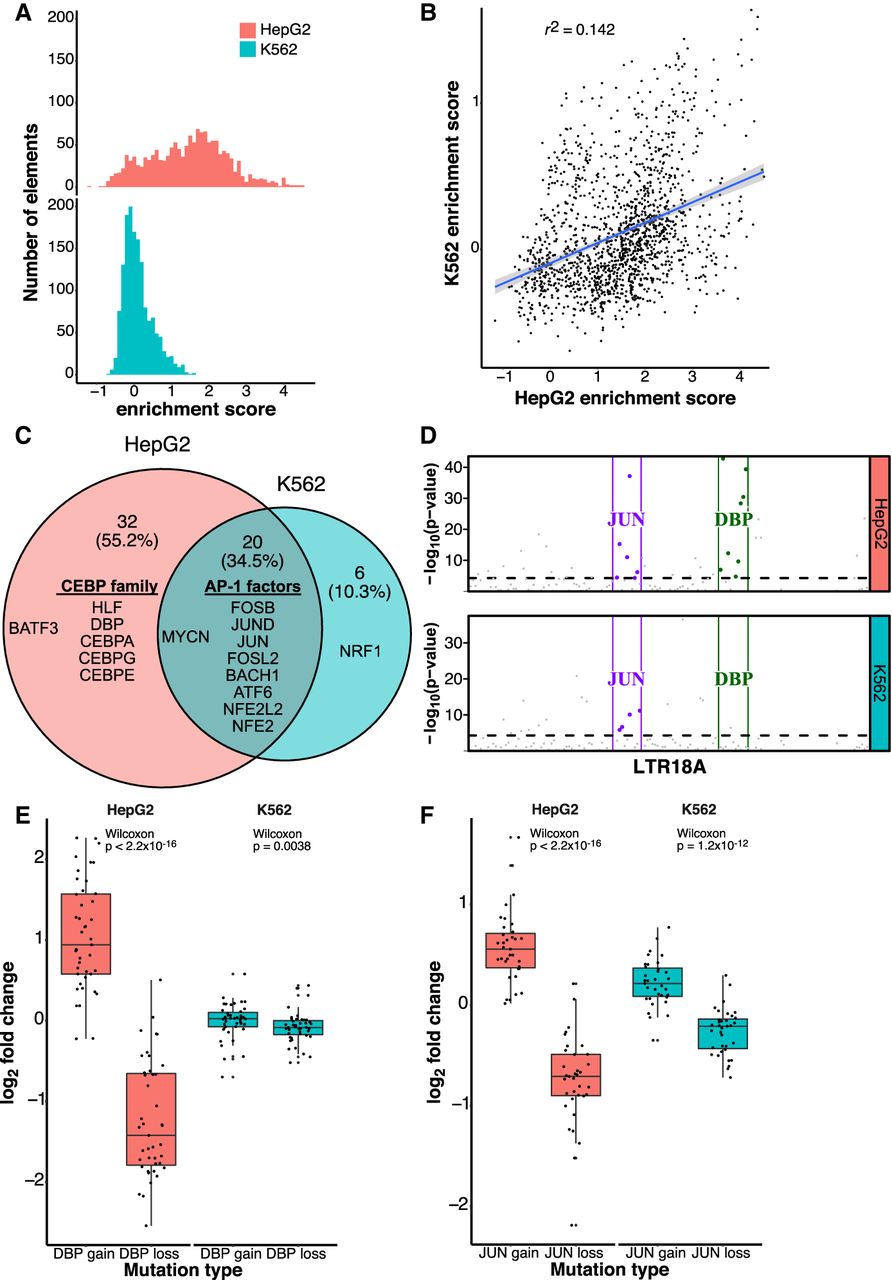
AP-1 motifs drive enhancer activity in HepG2 and K562, whereas CEBP motifs are HepG2 specific. (A) Distribution of enrichment scores of LTR18A motif-focused regions in HepG2 and K562. (B) Correlation of enrichment scores between HepG2 and K562. (C) Overlap of motifs significantly associated with active LTR18A. The top 10 transcription factor motifs in each cell line are displayed, with their placement in the Venn diagram determined by if the motif was found to be significant in one or both cell lines. AP-1- and CEBP-related transcription factors are grouped. (D) TEWAS significant nucleotides associated with active LTR18A. JUN and DBP motifs representing AP-1- and CEBP-related motifs are boxed. Significant positions (P < 5 × 10⁻⁵, above dotted line) within the two motifs that are associated with active elements are highlighted. (E) DBP mutagenesis effects on enhancer activity. (F) JUN mutagenesis effects on enhancer activity. P-values were derived from two-tailed Mann–Whitney U tests.


