
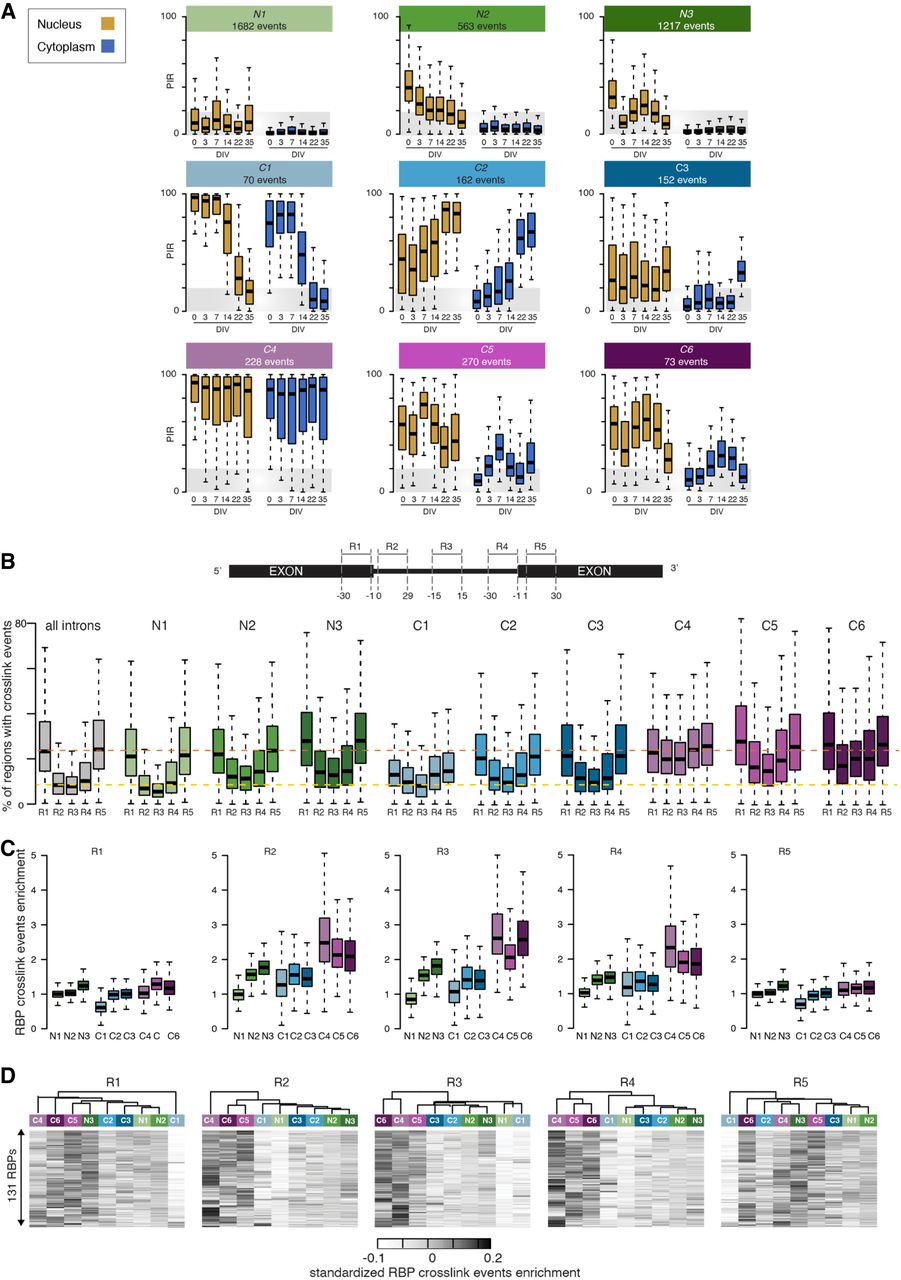
A spatiotemporal taxonomy reveals cytoplasmic IRTs with distinct RBP binding profiles. (A) Comparison of the nuclear and cytoplasmic PIR distributions for nine groups of retained introns showing distinct spatiotemporal dynamics during MN differentiation as identified using SVD (see Methods). N1, N2, and N3 contain introns primarily retained in the nuclear compartment, whereas the remaining six groups (C1–C6) contain introns with significant detection in the cytoplasm. Gold boxes indicate nucleus; blue boxes, cytoplasm. Gray area indicates the range of PIR values for which an intron is considered nonretained. (B, top) Schematic depicting the selected splicing regulatory regions juxtaposing the splice sites, namely, the last 30 nucleotides (nt) of the upstream exon (R1), the first 30 nt of 5′ intron region (R2), the 30 nt in the middle of the intron (R3), the last 30 nt of 3′ intron region (R4), and the first 30 nt of downstream exon (R5). (Bottom) Distributions of the percentage of regions in each group of introns that are mapped by at least one cross-link event for each of the available 131 RBPs. (C) Distribution of the enrichments in cross-link events in each of the selected regions R1, R2, R3, R4, and R5 for the available 131 RBPs across the nine categories of introns. Enrichment is obtained by dividing the fraction of regions from the group of interest with at least one cross-link event with the fraction of regions from the complete set of introns (n = 61,872) with a cross-link event. (D) Heatmaps of the enrichment scores of the cross-linking events for 131 RBPs in the R1, R2, R3, R4, and R5 regions for the nine groups of introns hierarchically clustered using Manhattan distance and Ward clustering. Data shown as box plots in which the center line is the median; limits are the interquartile range; and whiskers are the minimum and maximum.


