
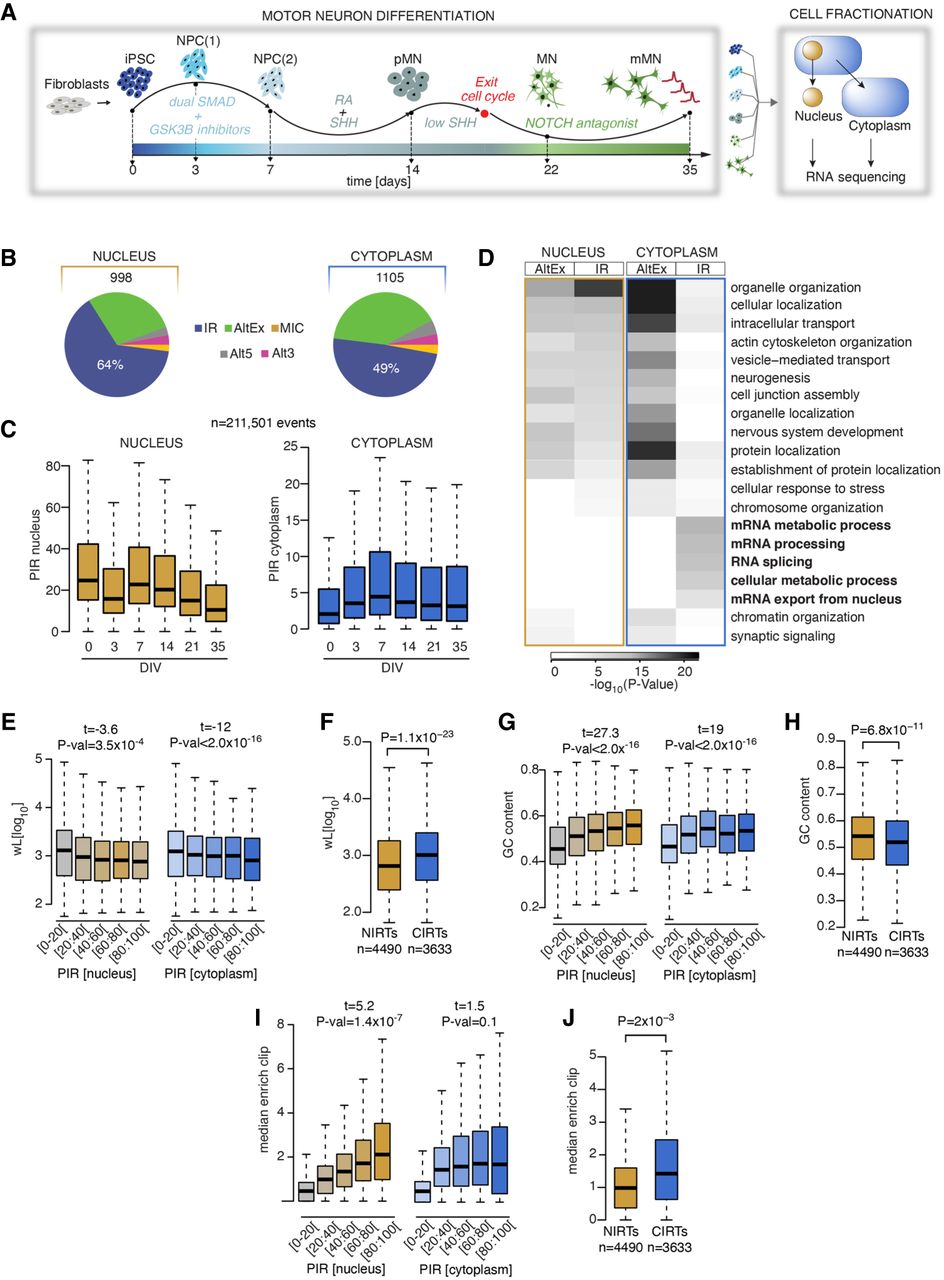
Nuclear and cytoplasmic intron retention (IR) affect two distinct mRNA subsets. (A) Schematic depicting the induced-pluripotent stem cell (iPSC) differentiation strategy for motor neurogenesis. Arrows indicate sampling time points in days when cells were fractionated into nuclear and cytoplasmic compartments before poly(A) RNA sequencing. Four iPSC lines were obtained from four independent healthy controls. (NPCs) Neural precursors, (pMNs) “patterned” precursor motor neurons (ventral spinal cord), (MNs) postmitotic but electrophysiologically inactive motor neurons, and (mMNs) electrophysiologically active MNs. (B) Pie charts representing proportions of pooled included splicing events in healthy control samples from distinct stages of motor neurogenesis compared with iPSCs or with a previous time point in nuclear (left) and cytoplasmic (right) fractions. Total number of events are indicated above the charts. (AltEx) Alternative exon, (MICs) microexons, and (Alt5 and Alt3) alternative 5′ and 3′ UTR. (C) Comparison of the percent intron retention (PIR) during MN differentiation in nucleus (left) and cytoplasm (right) for 21,161 events that show >10% PIR in at least three out of 47 nuclear samples. (D) Heatmap of the GO biological functions enriched among the genes showing AltEx or IR in either the nucleus or the cytoplasm. P-values obtained by Fisher's exact test. (E) Analysis of the relationship between intron length (wL) and the PIR in the nucleus (left) and the cytoplasm (right). P-values obtained from analysis of variance (see Methods). Retained introns are grouped in five categories of increasing level of retention, as indicated on the x-axis. (F) Comparison of intron length (wL) between nuclear and cytoplasmic retained introns. Nuclear retained introns are defined as introns showing >20% IR in the nuclear fraction and <5% IR in the cytoplasmic fraction. Cytoplasmic retained introns are defined as introns showing >20% IR in the nuclear fraction and >15% IR in the cytoplasmic fraction. P-values obtained from Mann–Whitney U test. (G) Analysis of the relationship between the PIR in the nucleus and %GC content. Data shown as in E. (H) Comparison of %GC content between nuclear and cytoplasmic retained introns. (I) Analysis of the relationship between the PIR in the nucleus and the median enrichment for RBP binding site, compared with the nonretained introns of the same gene. Data shown as in E. (J) Comparison of median enrichment for RBP binding sites between nuclear and cytoplasmic retained introns. (C,E–J) Data shown as box plots in which the center line is the median; limits are the interquartile range; and whiskers are the minimum and maximum.


