
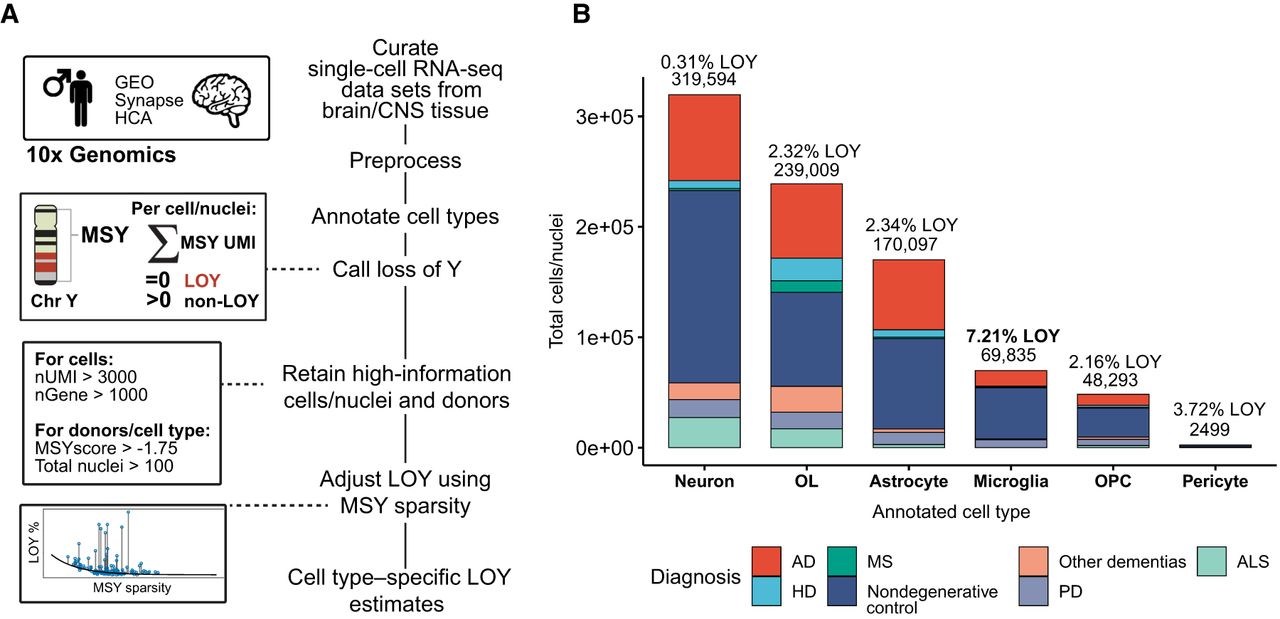
Figure 3.
Summary of brain LOY analysis workflow and combined sc/snRNA-seq brain data set. (A) Summary of methods used to estimate LOY in the brain. For additional information, see Supplemental Figure S2 and Methods. (B) Total number of included cells/nuclei annotated to each major brain cell type, colored by neurodegenerative diagnosis. Total nuclei/cell sample size and net LOY frequency are listed above each bar. Only droplet-based 10x Genomics sc/snRNA-seq data sets were considered for the study. Cells/nuclei with more than 3000 UMI counts and more than 1000 genes were included in LOY frequency analysis.


