
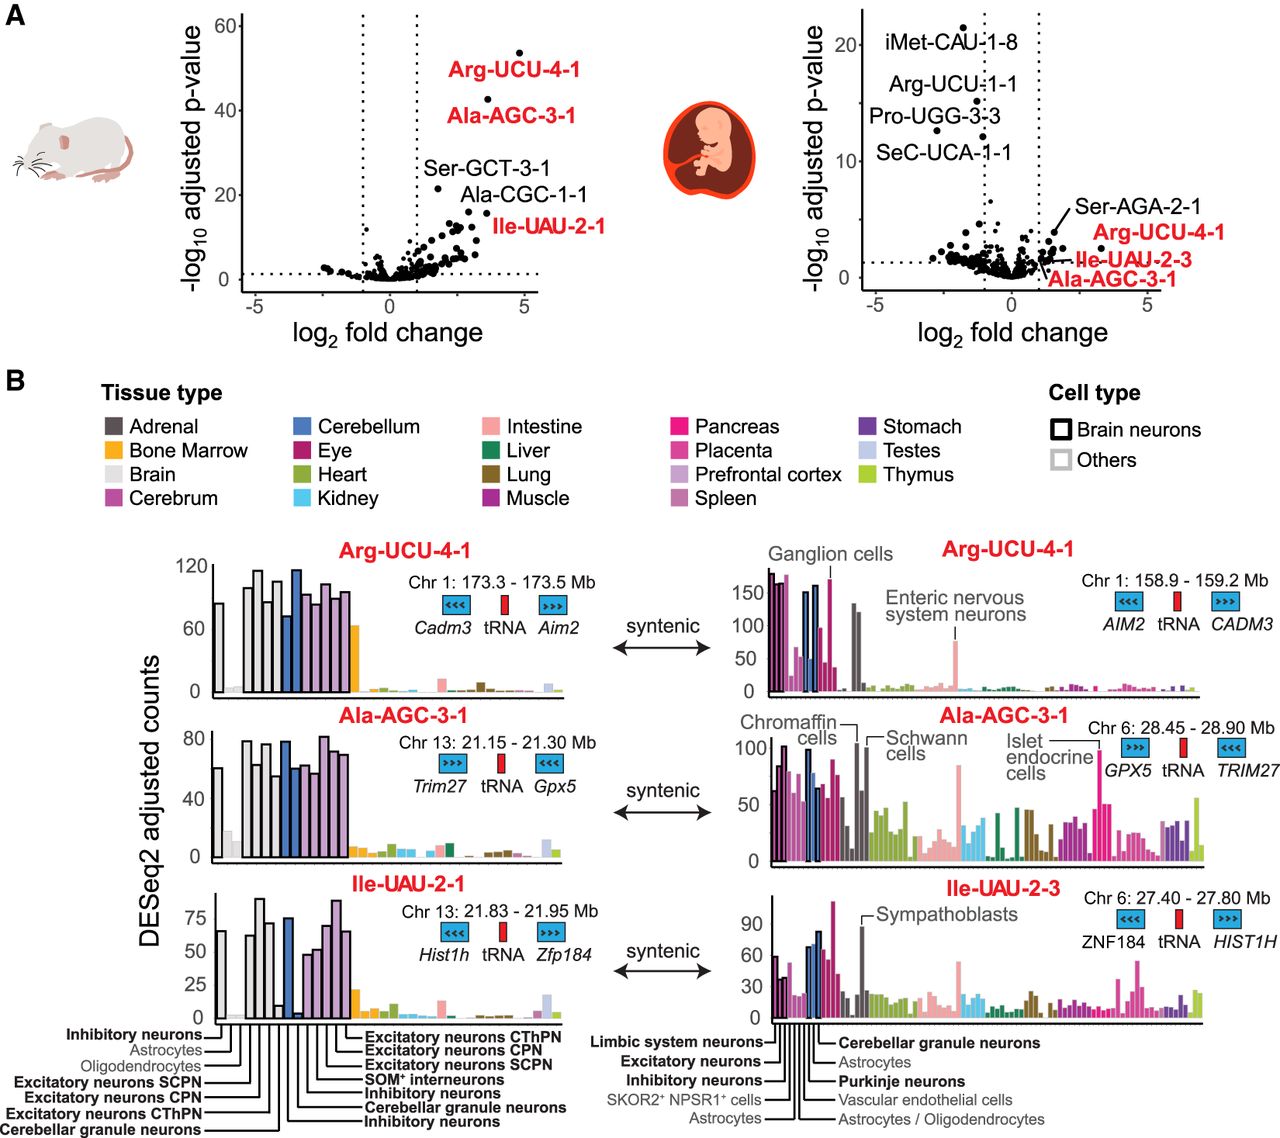
Some tRNA genes are enriched in brain neurons and conserved in the mouse and human. (A) Volcano plots show individual tRNA gene usage between brain neurons and all other cell types, displaying −log10 adjusted P-values and log2 FC, as determined using DESeq2. Red labels indicate syntenic tRNA genes significantly enriched in brain neurons in both the mouse (left) and human (right). Vertical lines indicate a FC >100%. (B) Bar plots show expression of syntenic, neuron-enriched tRNA genes. Each bar corresponds to a cell type filled according to the tissue type (top) and with border shading for brain neuron (black) and others (gray). Brain cell types (bottom), genomic location of the tRNA gene (red) with flanking protein-coding genes (blue) (top), and direction of gene transcription (arrows) are indicated.


