
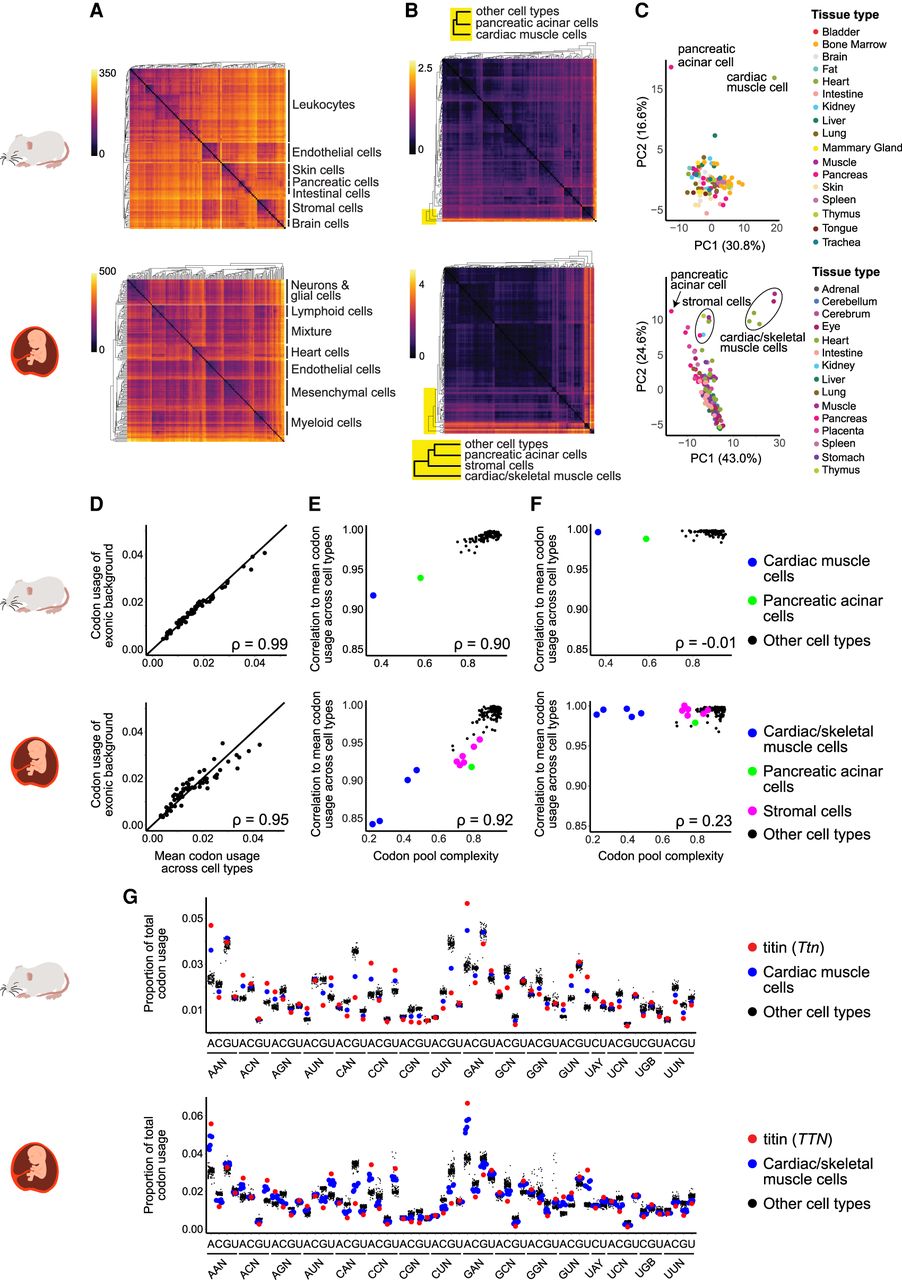
Codon usage is highly stable across cell types, with outliers driven by reduced codon pool complexity. (A,B) Heatmaps show Euclidean distance in gene expression (A) and codon usage (B) across cell types for mouse (top) and human (bottom). (C) Principal component analysis (PCA) plots cluster codon usage across cell types. (D–F) Scatter plots: (D) correlation of mean codon usage across all cell types to the exonic background (unweighted genome-wide codon usage; each point corresponds to one of the 61 sense codons); (E) each cell type's codon pool complexity (percentage of the total codon pool contributed by the top 10 genes) to the correlation of its cell type to the mean codon usage across all cell types; and (F) same quantities as E, but with each cell type's codon usage calculated while ignoring the codon contribution of the top 10 codon pool contributing genes. (G) Jitter plots show the proportion of total codon usage for each of the 61 sense codons in each cell type. Titin (red) drives the outlier status of cardiac and skeletal muscle cells (blue). IUPAC nucleotide codes are used in the x-axis (N = A, C, G, U; B = C, G, U; Y = C, U).


