
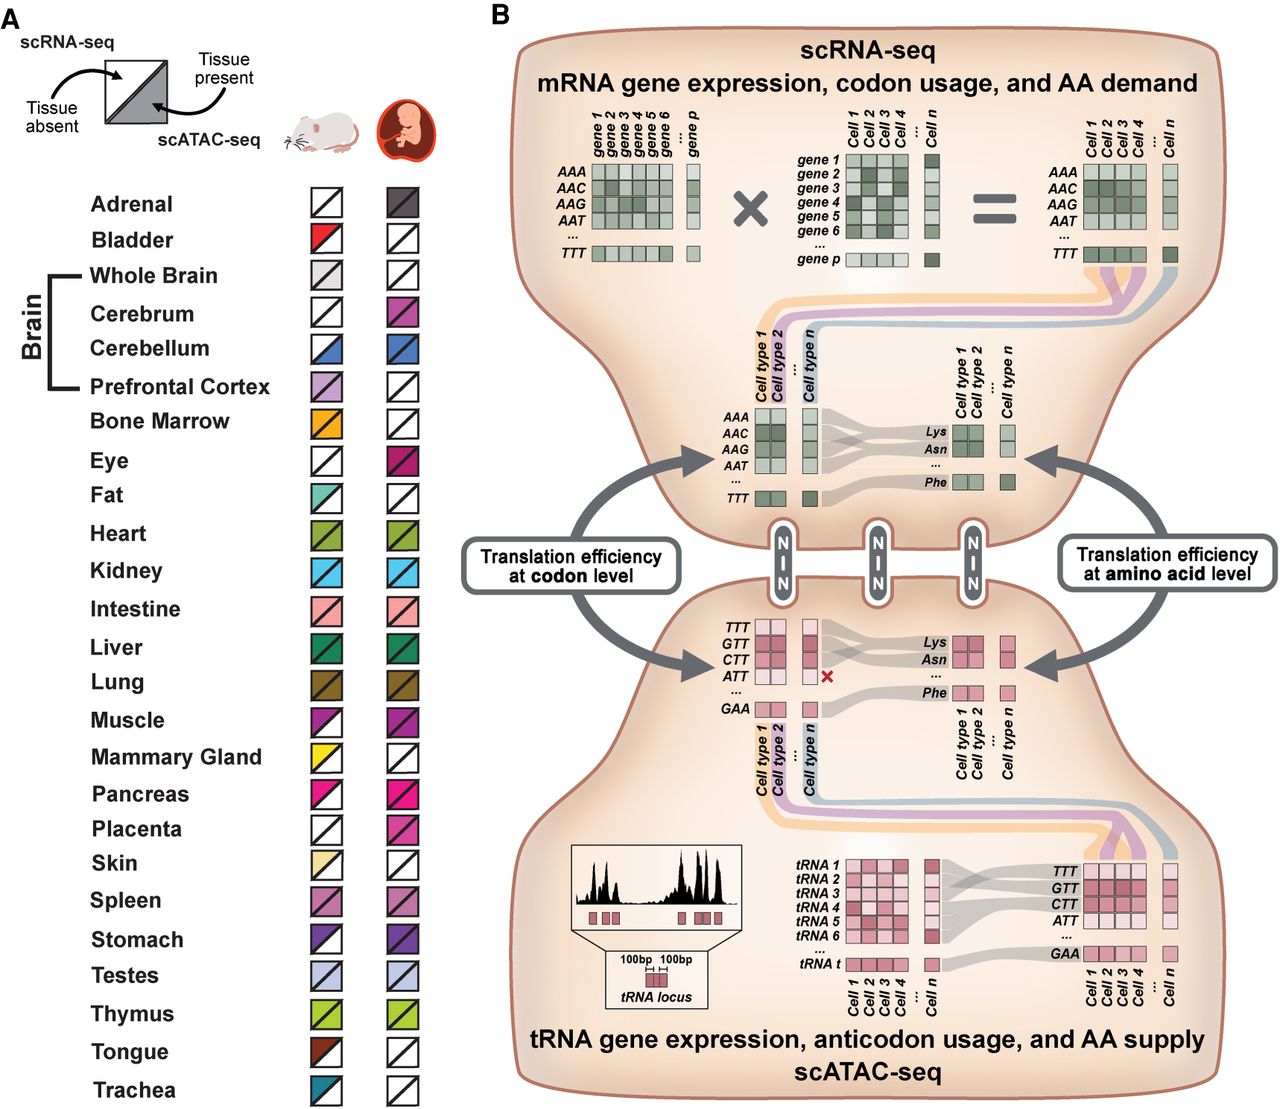
Overview of the approach for single-cell analysis of translation efficiency. (A) To examine a diverse set of cell types across multiple tissues, scRNA-seq and scATAC-seq atlases produced for mouse and human were analyzed. For both organisms, each square is color-filled if scRNA-seq (top half) or scATAC-seq data (bottom half) are present. (B, top) mRNA gene expression, codon usage, and amino acid (AA) demand can be quantified using single-cell RNA sequencing (scRNA-seq). Each gene's sense codon frequencies are weighted by gene expression counts. Codon usage from individual cells is pooled at the cell-type level and can be combined based on AA demand. (Bottom) tRNA gene expression, anticodon usage, and AA supply can be quantified using the single-cell assay for transposase accessible chromatin (scATAC-seq). First, the Tn5 transposase insertions mapping within tRNA gene loci and their surrounding 100-bp flanking regions are quantified, creating a tRNA gene expression matrix. Cells are pooled at the cell-type level and can be combined into anticodon isoacceptor families and AA isotypes. (Center) scRNA-seq and scATAC-seq data can be integrated to calculate a tTE score. For more detailed description, see Methods section.


