
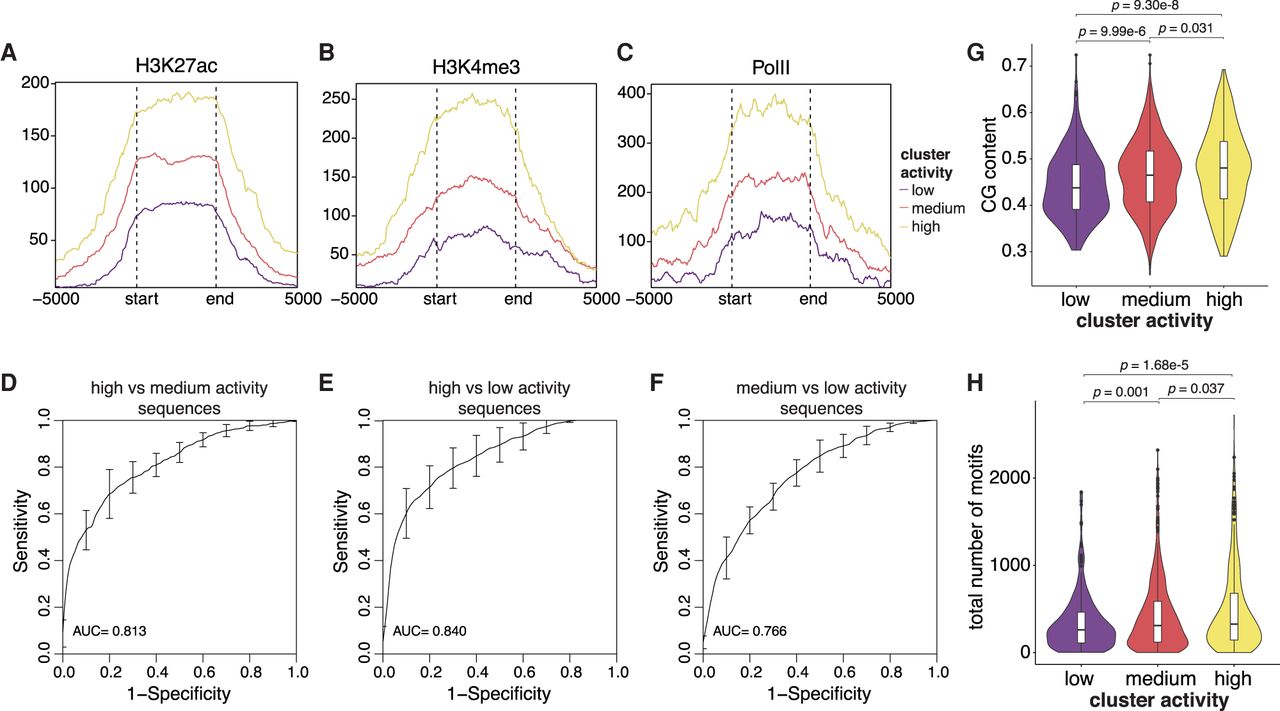
Genomic clusters have different chromatin states and sequence features. (A–C) Metaplots of H3K27ac, H3K4me3, and PolII levels, respectively, in each genomic cluster. The start and end marks the boundaries of each genomic region, which are determined by the first and last integration in the region. The x-axis extends ±5 kb around each genomic region. (D–F) Performance of gkmSVM used to classify sequences from different genomic clusters. Receiver-operating characteristics (ROCs) curves were generated using fivefold cross-validation. (G) The GC fraction of each genomic region was calculated and plotted for each cluster. (H) Number of TF binding sites in each genomic region was calculated and plotted for each cluster. P values were calculated by Student's t-tests.


