
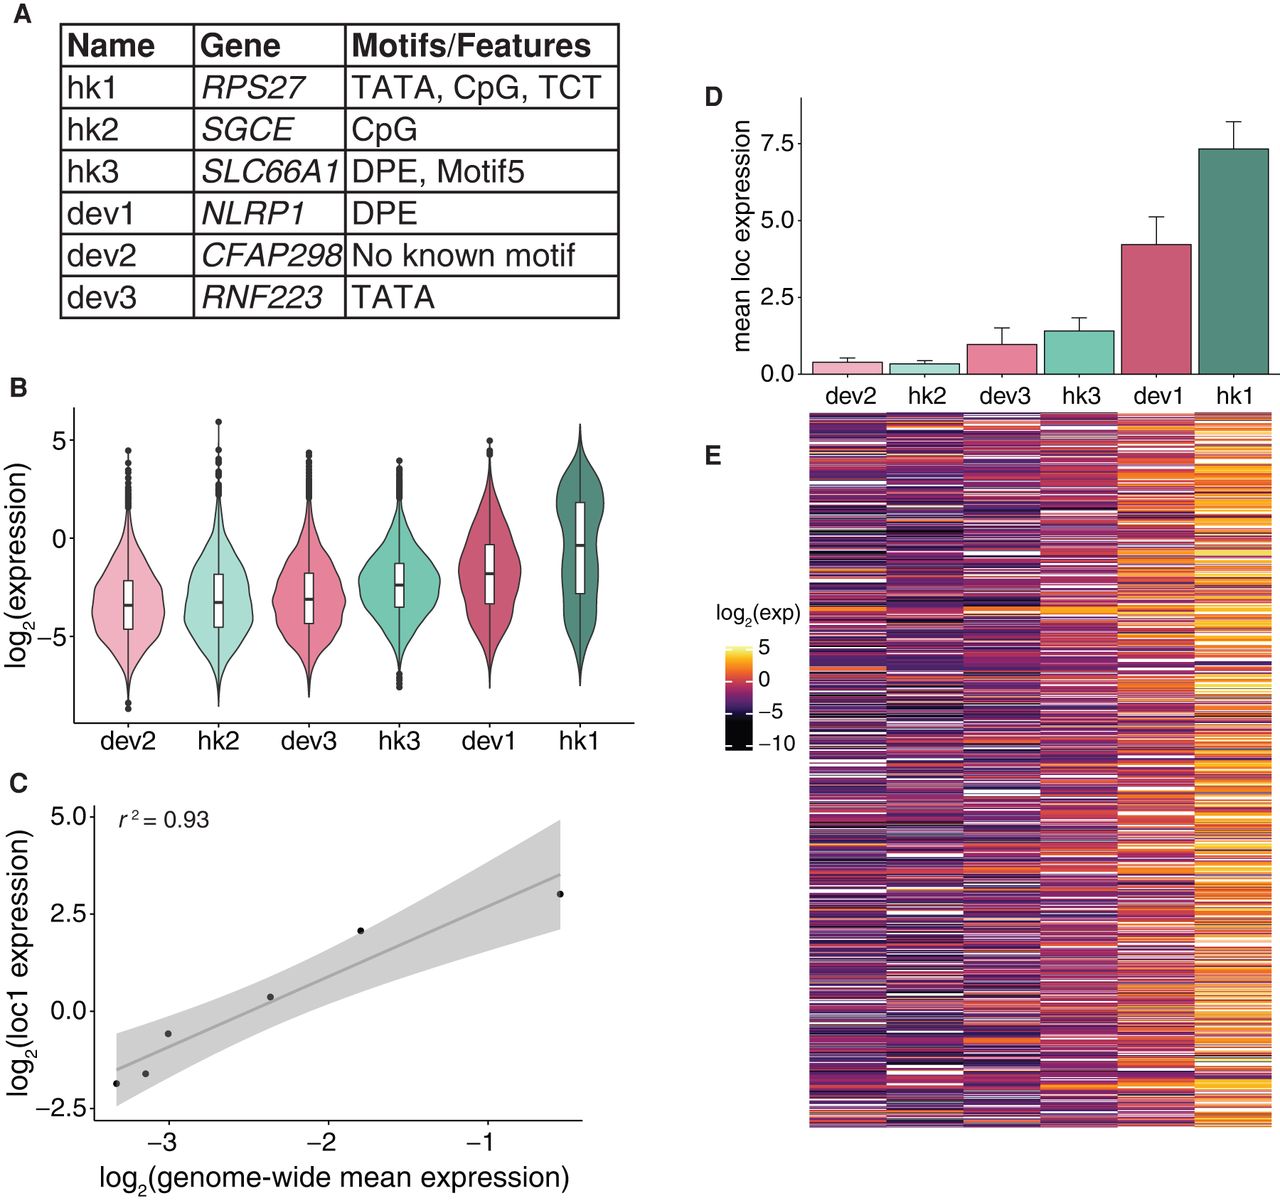
Core promoter scaling is a genome-wide phenomenon. (A) Features of core promoters selected for TRIP experiments. (B) Expression of each core promoter across all mapped genomic locations sorted by increasing means measured by TRIP. Blue-green denotes hk promoters and pink denotes dev promoters. (C) Correlation (Pearson's r) between mean expression of each core promoter genome-wide (measured by TRIP) and loc1. The shaded region around the fitted line represents the 95% confidence interval. (D) Mean expression of each core promoter from four genomic locations as measured by patchMPRA. Error bars represent the SEM. (E) Heat map of expression of each core promoter (column) at each genomic region (row) that has ≥4 different integrated promoters. White boxes represent NA values.


