
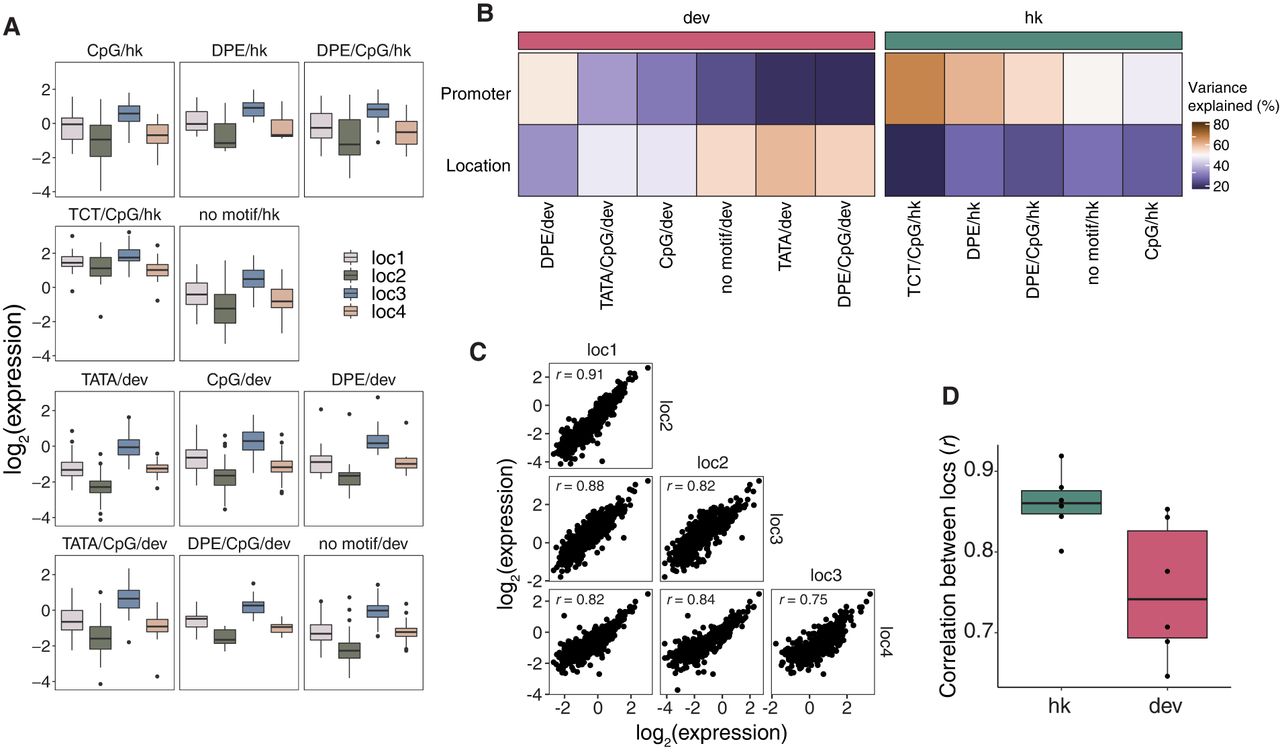
Figure 2.
Effects of genomic locations on core promoter activity. (A) Expression of each class of core promoter motifs at each genomic location. (B) Amount of variance explained by core promoter and genomic location, respectively, using linear models fit on each class of core promoters separately. (C) Pairwise correlations (Pearson's r) of core promoter activity between the different genomic locations. (D) All pairwise correlations (Pearson's r) between genomic locations for hk and dev core promoters.


